AUD/JPY Price Analysis: Pair weakens further as bears maintain pressure below 92.50
- AUD/JPY trades near the 92.40 zone on Thursday, extending its daily decline ahead of the Asian session.
- Momentum signals tilt bearish with MACD and Awesome Oscillator flashing sell signals, while RSI remains neutral.
- Key resistance zones stand near 93.30 and 93.80, while sellers keep pressure under longer-term SMAs.
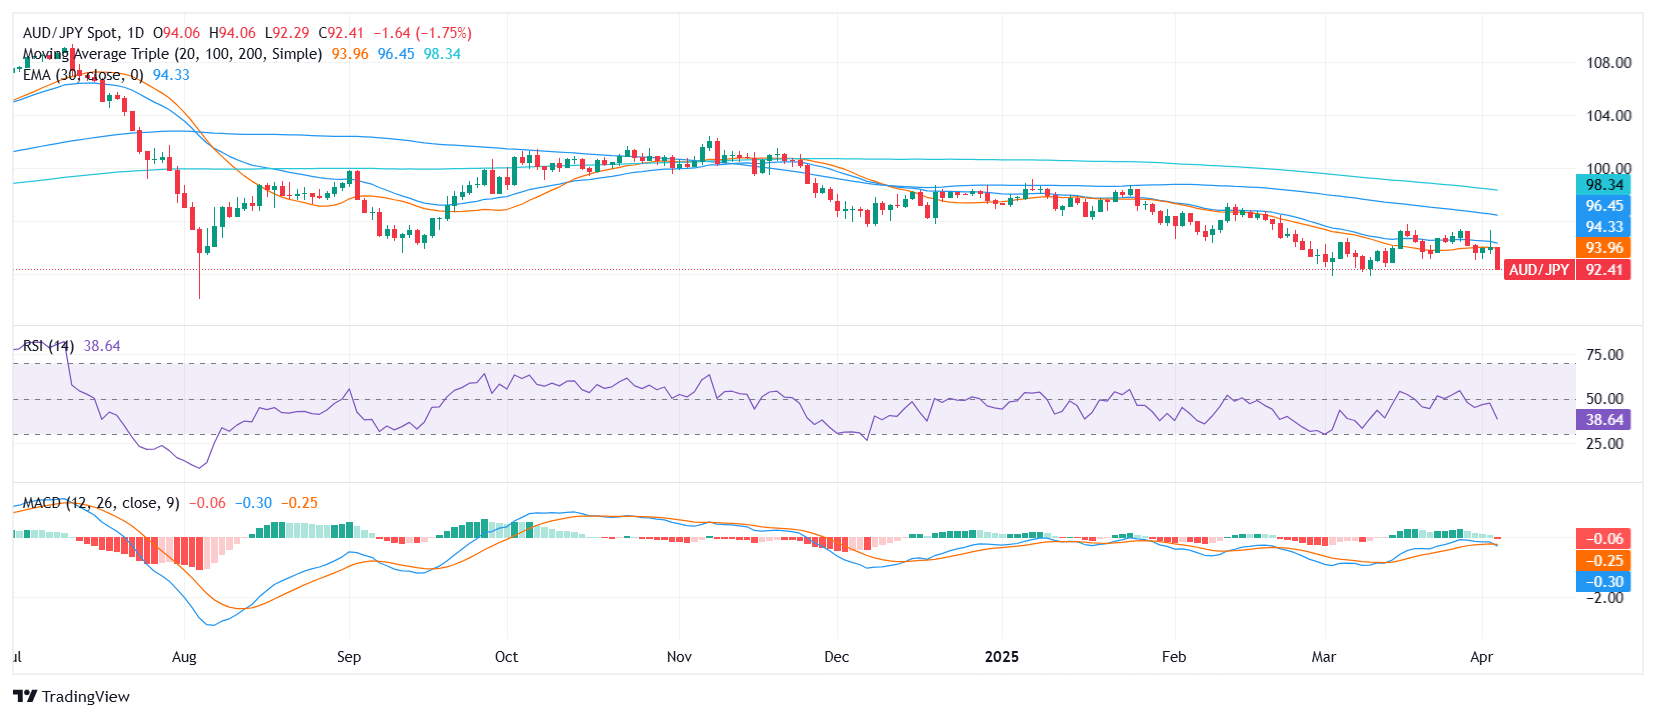
AUD/JPY saw renewed bearish momentum on Thursday, falling toward the 92.40 region and erasing recent recovery attempts. The pair slid deeper into the lower half of its daily range, suggesting continued selling bias as market participants reassess risk appetite ahead of the Asian session. Despite neutral signals from some oscillators, overall technical conditions favor further downside pressure.
Daily chart

The short-term technical landscape confirms a bearish tone. The Relative Strength Index (RSI) prints at 39.22, sitting in neutral territory but nearing oversold levels. Meanwhile, the Moving Average Convergence Divergence (MACD) issues a firm sell signal, while the Awesome Oscillator follows suit at -0.373, reinforcing negative momentum. The Commodity Channel Index (CCI) at -98.09, while neutral, leans toward bearish territory as well.
Adding to the downside bias, the pair remains below several key moving averages. The 20-day Simple Moving Average (SMA) at 93.97, 100-day at 96.54, and 200-day at 98.44 all point south, joined by the 10-day EMA and SMA around the 94.00–94.15 area, signaling persistent bearish pressure from a trend perspective.
Immediate resistance is seen at 93.30, followed by 93.78 and 93.80. These levels could act as barriers if the pair attempts a corrective bounce. On the downside, the 92.28 zone marks the session low and immediate support. A break below that area could open the door toward further losses.
Overall, unless AUD/JPY reclaims territory above the key moving averages, sellers are likely to retain control in the short term.

