
NZD/USD Price Analysis: Kiwi extends losses toward mid-0.5600s as bearish tone prevails
- NZD/USD trades near the 0.5670 zone ahead of the Asian session, slipping further within Monday's intraday range.
- The bearish bias strengthens as the pair breaks below key averages while technical indicators remain broadly negative.
- Support lies below recent lows, while resistance aligns near the 0.5700–0.5710 congestion area.
NZD/USD extended its decline on Monday’s session ahead of the Asian open, slipping to the mid-0.5600s and pressing into the lower half of the recent range. The pair remains under pressure as technical indicators flash bearish cues, with sellers gaining the upper hand after a failed attempt to consolidate around the 0.5730 zone.
Daily chart
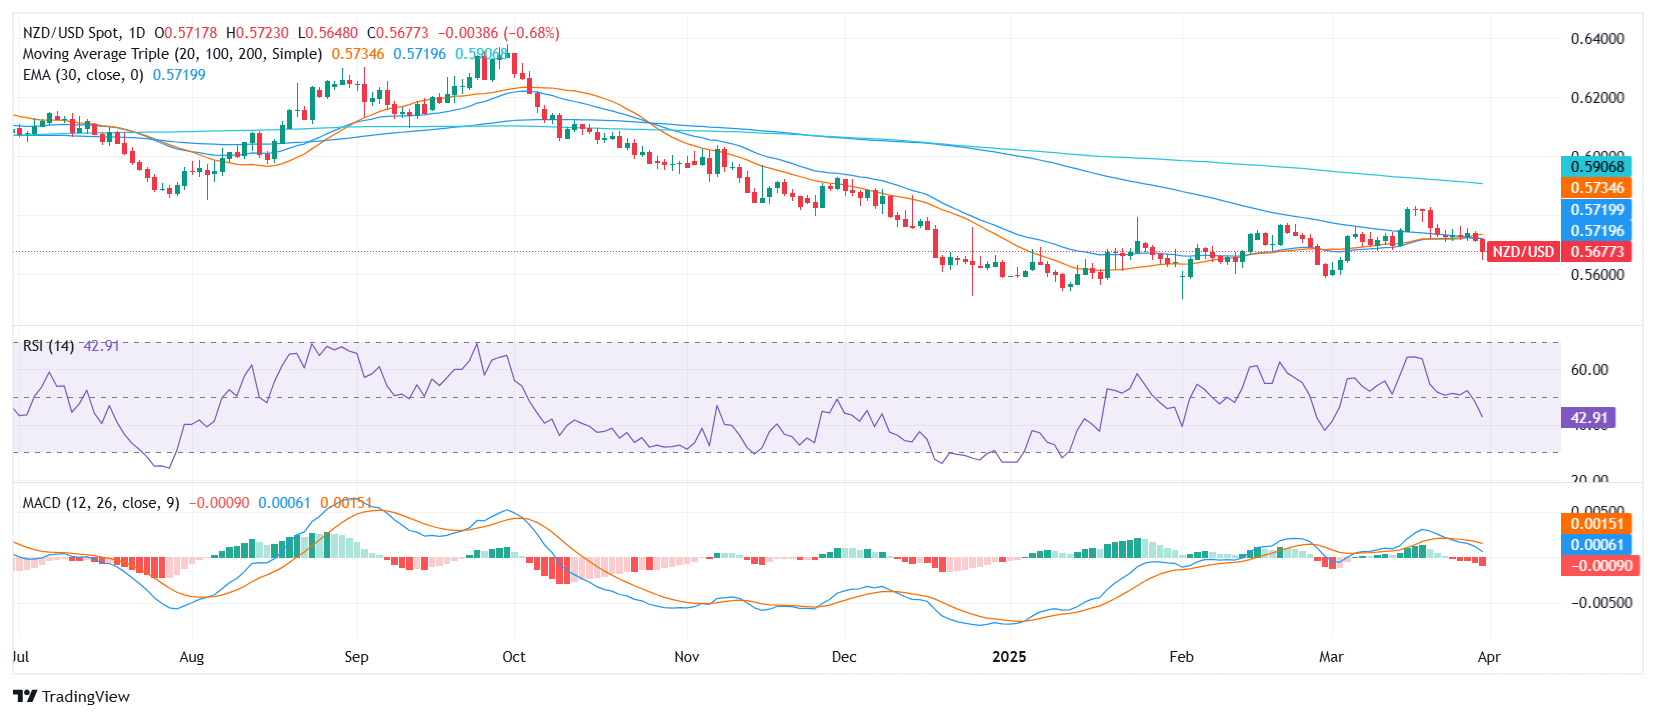
The Moving Average Convergence Divergence (MACD) signals a fresh sell bias, while the Relative Strength Index (14) prints at 42.7 is gradually moving lower. The Awesome Oscillator echoes a similar neutral tone, suggesting a lack of bullish conviction in the short term.
From a trend perspective, selling pressure is confirmed by key moving averages. The 20-day Simple Moving Average (SMA) at 0.57347, 100-day SMA at 0.57269, and the longer-term 200-day SMA at 0.59120 all slope downward, reinforcing a bearish structure. Additional short-term signals from the 10-day EMA at 0.57267 and 10-day SMA at 0.57449 also support the downside outlook.
On the downside, the next line of support may emerge below 0.5670, with previous swing lows and psychological barriers likely to be tested. Resistance remains capped near 0.5700, followed by 0.57050 and 0.57084. A break above these could ease short-term pressure, but the broader structure remains tilted to the downside unless buyers reclaim ground above the 20 and 100-day SMAs.
추천 기사


