
NZD/USD Price Analysis: Edges higher toward 0.5740 as bulls cling to short-term momentum
- NZD/USD was seen trading near the 0.5740 zone on Thursday, posting modest gains ahead of the Asian session.
- Despite mixed oscillator signals, the pair maintains a bullish outlook supported by short-term moving averages.
- Key support lies near 0.5725 while resistance levels cluster just above 0.5740; congestion near 100- and 200-day SMAs may limit upside.
The NZD/USD pair posted mild gains on Thursday, edging higher toward the 0.5740 area after the European session and entering the Asian session on a firmer note. The Kiwi trades near the upper bound of its intraday range, supported by a modest recovery in sentiment. While short-term momentum appears constructive, technical indicators continue to flash mixed signals, warranting cautious optimism heading into Friday.
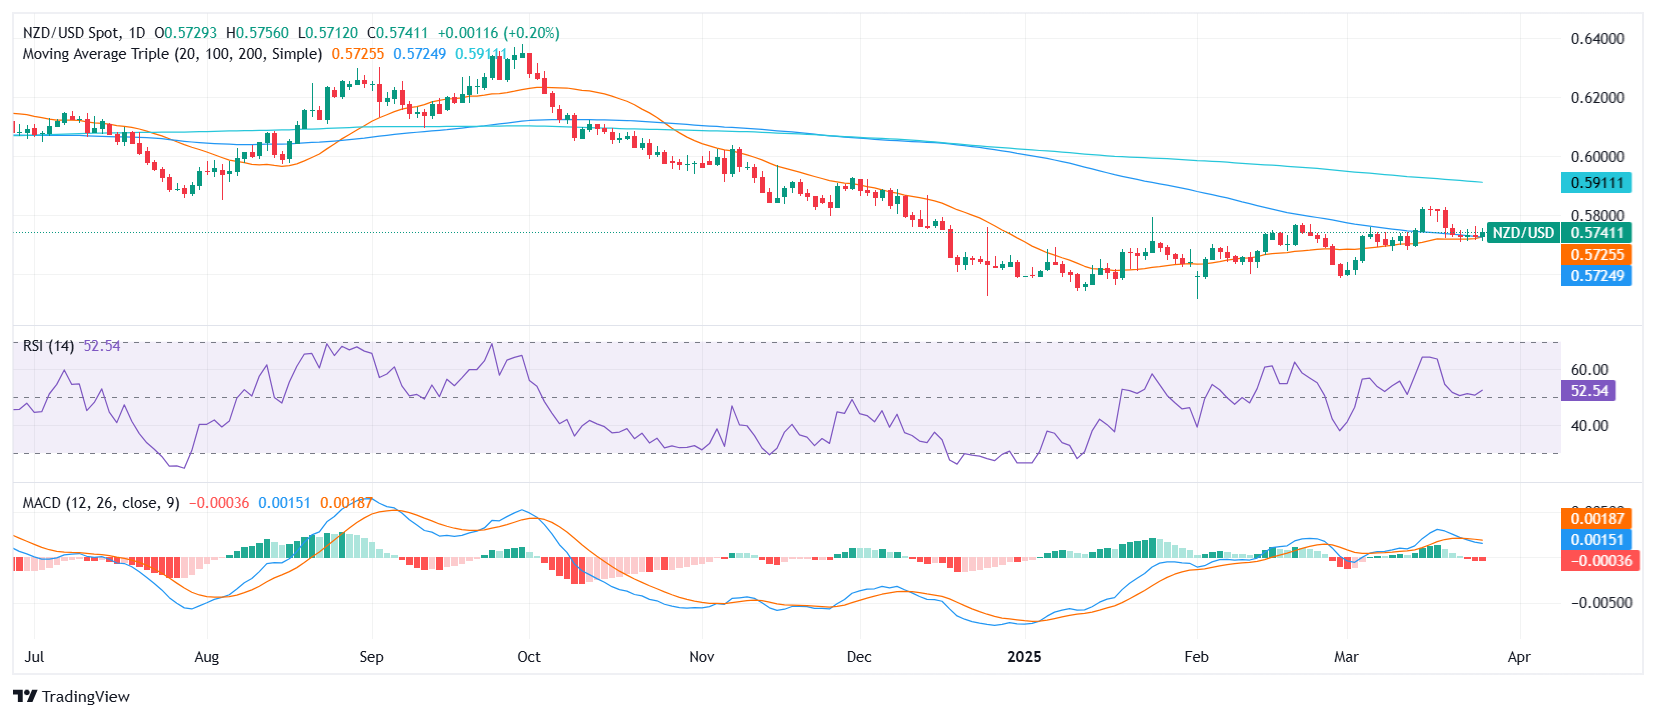
The Relative Strength Index (14) sits at a neutral 50.6, while the MACD continues to signal slight selling pressure. However, the Bull Bear Power indicator suggests mild buying interest. Additionally, while shorter-term averages — the 20-day Simple Moving Average (SMA) at 0.5725 and the 30-day Exponential and Simple Moving Averages at 0.5722 — signal a bullish tilt, the 100-day and 200-day SMAs, at 0.5732 and 0.5916 respectively, suggest lingering downside pressure and create a congestion zone that could cap upside momentum.
In terms of levels, support is seen at 0.5725, followed by 0.5722 and 0.5720. On the upside, immediate resistance is located at 0.5732 and 0.5740, with a potential breakout above paving the way for a broader recovery. Still, traders should keep a close eye on how price behaves around the convergence of the 100- and 200-day SMAs, which may act as a pivot area for the next directional move.
NZD/USD daily chart
추천 기사


