


EUR/USD Price Analysis: Bulls maintain control near mid-range despite mixed momentum
- EUR/USD was seen around the 1.0800 zone after rising modestly following the European session on Tuesday.
- Despite neutral momentum indicators and a sell MACD signal, the broader trend remains bullish above key moving averages.
- Support lies near 1.0790 and 1.0764, while resistance awaits around 1.0830 and 1.0865.
The EUR/USD pair was seen trading around the 1.0800 area during Tuesday’s session after the European close, holding modest gains on the day. Despite a subdued intraday range, the overall outlook remains bullish as the pair sits comfortably above its key moving averages. Momentum indicators remain mixed, suggesting limited short-term conviction, yet broader trend signals support the bullish bias.
The Relative Strength Index (14) is currently neutral at 59.26, while the Stochastic %K (14, 3, 3) reads 51.66, both indicating a lack of strong momentum in either direction. The combined RSI/Stochastic reading also reflects a neutral setup, signaling some hesitation in the recent upside momentum. However, the MACD presents a mild sell signal, which could suggest a brief pause or consolidation.
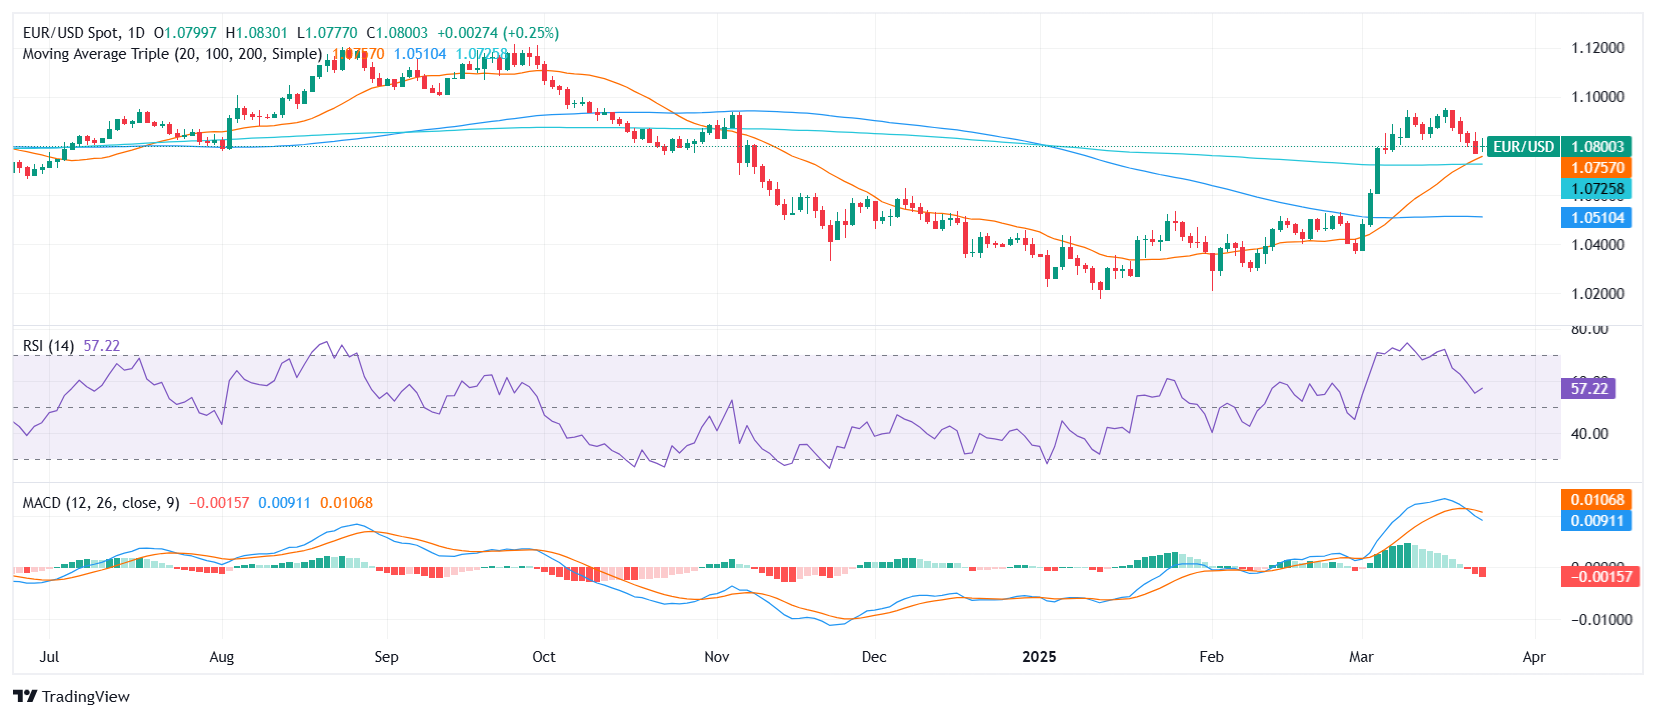
Despite these neutral momentum indicators, the trend picture remains constructive. The pair is comfortably above its 20-day SMA (1.07589), 100-day SMA (1.05209), and 200-day SMA (1.07290). Additionally, bullish signals from the 30-day EMA (1.07019) and SMA (1.06600) continue to underpin the upside structure. These levels form a strong technical foundation, reinforcing buyers’ control in the medium term.
On the downside, immediate support is located around 1.07913, followed by 1.0764 and the 20-day SMA at 1.07589. Resistance sits at 1.08297—today’s upper range boundary—and 1.08657, which marks a potential upside breakout zone if momentum returns. As long as EUR/USD holds above the 1.0750/1.0730 zone, the outlook remains skewed to the upside.
EUR/USD daily chart
추천 기사


