


NZD/USD Price Forecast: Finds initial resistance at 0.5750 near nine-day EMA
- NZD/USD challenges the immediate resistance at the nine-day EMA of 0.5753 level.
- Technical analysis of the daily chart suggests a strengthening bullish bias.
- On the downside, the nearest support is at the 50-day EMA, around 0.5717.
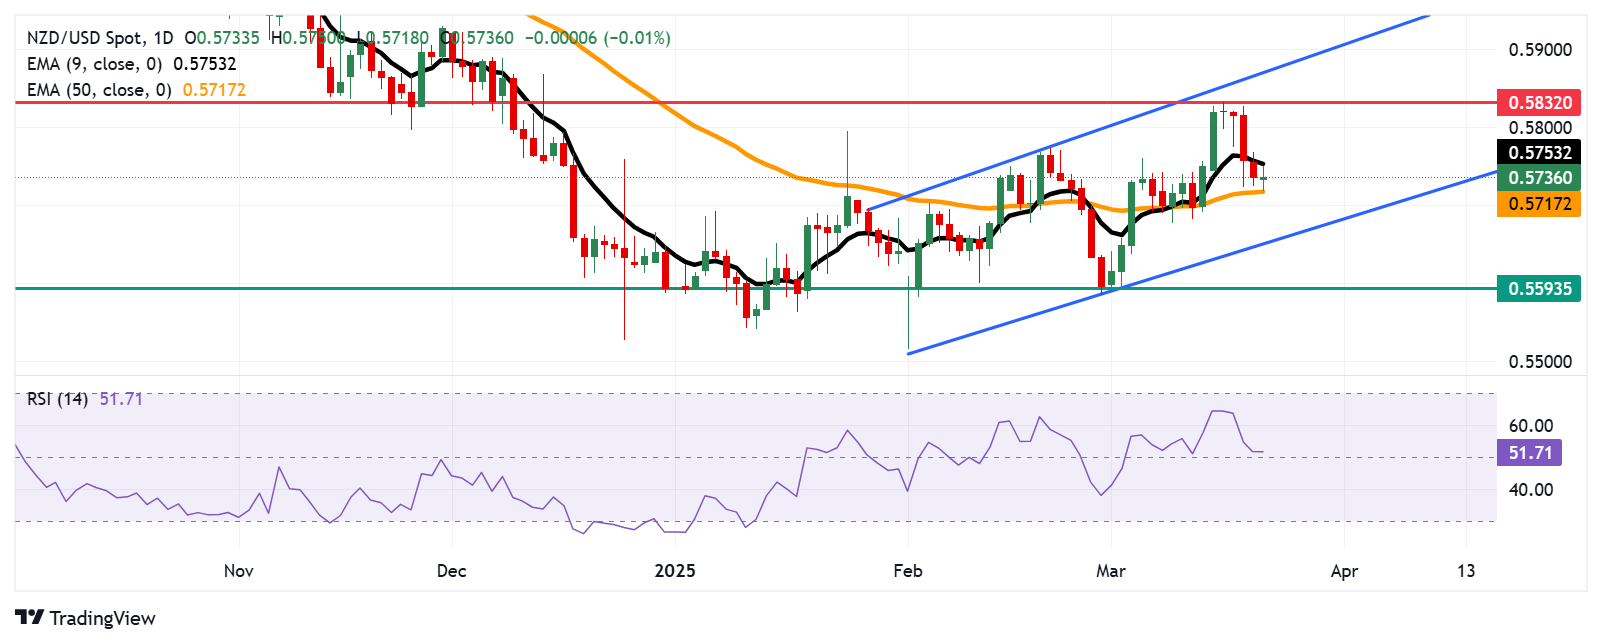
NZD/USD rebounds after four consecutive losing sessions, trading around 0.5730 during European hours on Monday. Technical analysis of the daily chart indicates a developing bullish bias as the pair moves within an ascending channel pattern.
The nine-day Exponential Moving Average (EMA) remains above the 50-day EMA, suggesting an ongoing recovery in the overall trend. However, the pair's drop below the nine-day EMA signals short-term weakness, indicating a temporary loss of momentum. This points to a bearish short-term trend within a broader bullish framework. Additionally, the 14-day Relative Strength Index (RSI) remains above 50, suggesting the positive bias is active.
On the upside, the NZD/USD pair tests the immediate barrier at a nine-day EMA of 0.5753 level. A break above this level could improve the short-term price momentum and support the pair to explore the region around the three-month high at 0.5832, reached on March 18. Further resistance appears at the upper boundary of the ascending channel near the 0.5870 level.
The immediate support is located at the 50-day EMA of 0.5717. A decisive break below this level could weaken medium-term momentum, applying downward pressure on the NZD/USD pair to navigate the area around the ascending channel’s lower boundary at 0.5650 level.
A break below the channel could reinforce the bearish bias and drive the NZD/USD pair to approach the monthly low at 0.5593, recorded on March 3.
NZD/USD: Daily Chart
New Zealand Dollar PRICE Today
The table below shows the percentage change of New Zealand Dollar (NZD) against listed major currencies today. New Zealand Dollar was the strongest against the Japanese Yen.
| USD | EUR | GBP | JPY | CAD | AUD | NZD | CHF | |
|---|---|---|---|---|---|---|---|---|
| USD | -0.25% | -0.27% | 0.16% | -0.15% | -0.38% | -0.04% | -0.10% | |
| EUR | 0.25% | -0.12% | -0.10% | 0.15% | -0.14% | 0.26% | 0.20% | |
| GBP | 0.27% | 0.12% | 0.43% | -0.36% | -0.05% | 0.39% | 0.22% | |
| JPY | -0.16% | 0.10% | -0.43% | -0.31% | -0.56% | -0.18% | -0.27% | |
| CAD | 0.15% | -0.15% | 0.36% | 0.31% | -0.18% | 0.11% | 0.05% | |
| AUD | 0.38% | 0.14% | 0.05% | 0.56% | 0.18% | 0.42% | 0.35% | |
| NZD | 0.04% | -0.26% | -0.39% | 0.18% | -0.11% | -0.42% | 0.00% | |
| CHF | 0.10% | -0.20% | -0.22% | 0.27% | -0.05% | -0.35% | -0.01% |
The heat map shows percentage changes of major currencies against each other. The base currency is picked from the left column, while the quote currency is picked from the top row. For example, if you pick the New Zealand Dollar from the left column and move along the horizontal line to the US Dollar, the percentage change displayed in the box will represent NZD (base)/USD (quote).
추천 기사


