
Australian Dollar remains firm following Judo Bank PMI data
- The Australian Dollar strengthens after the release of upbeat Judo Bank Purchasing Managers Index data on Monday.
- Australia’s Judo Bank Manufacturing PMI rose to 52.6 in March, while the Services PMI increased to 51.2.
- The US Dollar faces pressure as concerns grow over a potential economic slowdown driven by Trump’s trade policies.
The Australian Dollar (AUD) strengthens against the US Dollar (USD) on Monday after two consecutive days of losses. The AUD/USD pair rises as the AUD finds support following the release of preliminary Judo Bank Purchasing Managers Index (PMI) data.
Australia’s Judo Bank Manufacturing PMI climbed to 52.6 in March from 50.4 in February, while the Services PMI improved to 51.2 from 50.8. The Composite PMI also increased, reaching 51.3 in March compared to 50.6 previously.
The AUD also gains traction as analysts anticipate the Reserve Bank of Australia (RBA) will keep rates unchanged in April after cutting borrowing costs for the first time in four years in February. Furthermore, expectations of Chinese stimulus boost the Australian economy.
The AUD/USD pair also benefits from improved risk sentiment as the White House adjusts its tariff strategy ahead of the April 2 implementation, according to the Wall Street Journal. Moreover, geopolitical tensions ease as Ukrainian and US officials meet in Riyadh on Sunday to discuss peace efforts. Meanwhile, President Trump continues to advocate for an end to the three-year war.
Australian Dollar appreciates as US Dollar struggles amid economic concerns
- The US Dollar Index (DXY), which tracks the USD against six major currencies, pauses its three-day winning streak and is trading lower near 104.00. The Greenback comes under pressure as concerns grow over a potential US economic slowdown, fueled by trade policies under President Trump. Meanwhile, traders await the preliminary reading of the US S&P Global Manufacturing Purchasing Managers Index (PMI) for March.
- However, the US Dollar gained ground after hawkish remarks from Fed Chair Jerome Powell last week, who stated, “Labor market conditions are solid, and inflation has moved closer to our 2% longer-run goal, though it remains somewhat elevated.”
- President Trump suggested there could be room for "talk" on trade issues with China and expressed hope for a meeting with Chinese President Xi Jinping in the near future. Earlier this month, his proposal to strengthen US shipbuilding by imposing steep fees on China-linked vessels entering American ports led to a buildup of US coal inventories and heightened uncertainty in the already struggling agriculture sector.
- Australia’s Employment Change dropped by 52.8K in February against the 30.5K increase in January (revised from 44K), falling short of the consensus forecast of 30.0K rise. Meanwhile, the seasonally adjusted Unemployment Rate remained steady at 4.1% in February, aligning with market expectations.
- China’s ruling Communist Party (CCP) central committee and State Council have suggested ambitious plans to "vigorously boost consumption" by raising wages and easing financial burdens. This latest initiative aims to restore consumer confidence and revitalize the country’s struggling economy.
- “We see a gradual recovery in the Australian dollar from the second quarter onward, propelled first by dollar depreciation followed by the lagged impact of China stimulus in the second half of 2025,” said Oliver Levingston, a strategist at Bank of America in Sydney.
- Last week, Reserve Bank of Australia (RBA) Assistant Governor (Economic) Sarah Hunter reiterated the central bank’s cautious stance on rate cuts. The RBA’s February statement signaled a more conservative approach than market expectations, with a strong focus on monitoring US policy decisions and their potential impact on Australia’s inflation outlook.
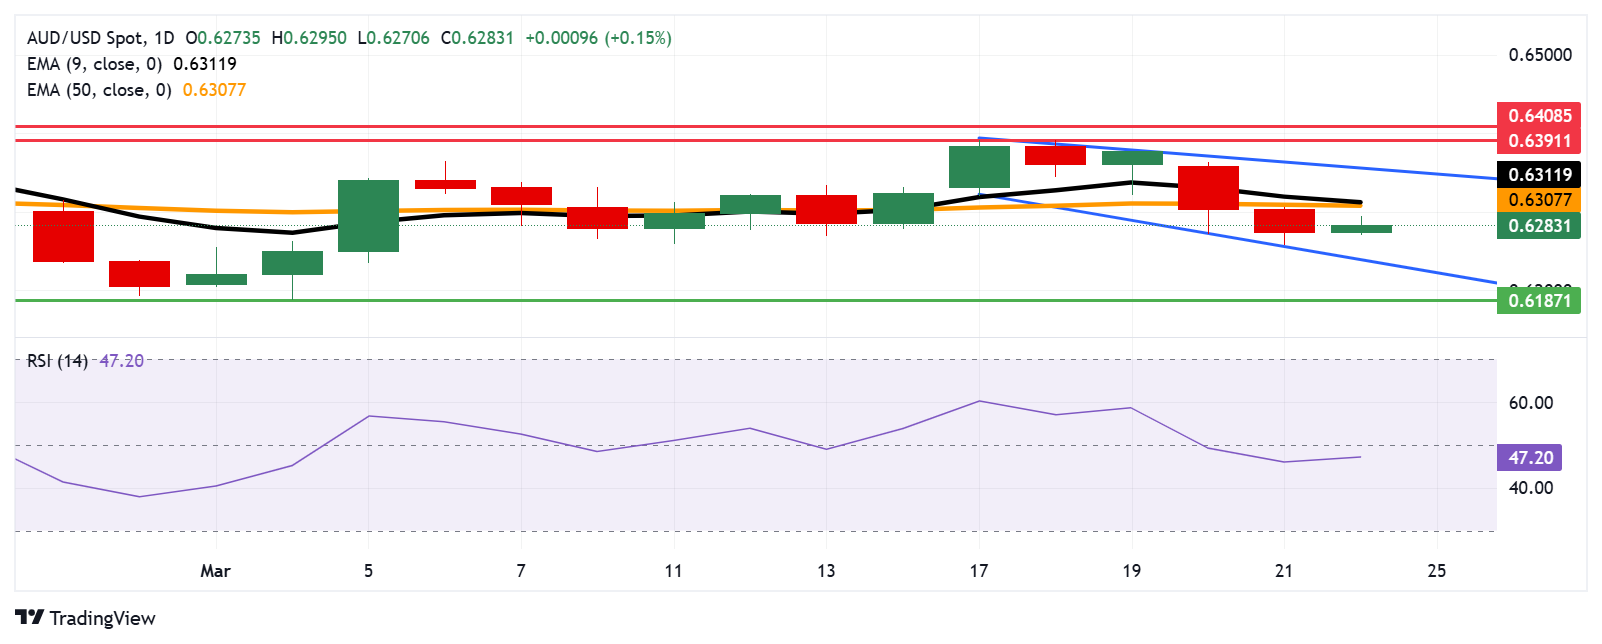
Australian Dollar could test 0.6300 barrier near 50-day EMA
The AUD/USD pair is hovering near 0.6290 on Monday, with technical indicators pointing to a bearish bias as the pair remains within a descending channel pattern. The 14-day Relative Strength Index (RSI) sits slightly below 50, confirming persistent bearish momentum.
Immediate support is found at the lower boundary of the descending channel around 0.6240. A break below this level could strengthen the bearish outlook, pushing the AUD/USD pair toward the seven-week low of 0.6187, recorded on March 5.
On the upside, initial resistance is seen at the 50-day Exponential Moving Average (EMA) of 0.6307, closely followed by the nine-day EMA at 0.6311. A breakout above these levels could boost short-term price momentum, with the AUD/USD pair potentially testing the upper boundary of the descending channel at 0.6360.
AUD/USD: Daily Chart
Australian Dollar PRICE Today
The table below shows the percentage change of Australian Dollar (AUD) against listed major currencies today. Australian Dollar was the strongest against the Japanese Yen.
| USD | EUR | GBP | JPY | CAD | AUD | NZD | CHF | |
|---|---|---|---|---|---|---|---|---|
| USD | -0.08% | -0.07% | 0.31% | -0.09% | -0.18% | 0.04% | 0.06% | |
| EUR | 0.08% | -0.10% | -0.13% | 0.03% | -0.12% | 0.16% | 0.18% | |
| GBP | 0.07% | 0.10% | 0.39% | -0.50% | -0.06% | 0.26% | 0.17% | |
| JPY | -0.31% | 0.13% | -0.39% | -0.40% | -0.52% | -0.26% | -0.27% | |
| CAD | 0.09% | -0.03% | 0.50% | 0.40% | -0.04% | 0.13% | 0.15% | |
| AUD | 0.18% | 0.12% | 0.06% | 0.52% | 0.04% | 0.29% | 0.31% | |
| NZD | -0.04% | -0.16% | -0.26% | 0.26% | -0.13% | -0.29% | 0.09% | |
| CHF | -0.06% | -0.18% | -0.17% | 0.27% | -0.15% | -0.31% | -0.09% |
The heat map shows percentage changes of major currencies against each other. The base currency is picked from the left column, while the quote currency is picked from the top row. For example, if you pick the Australian Dollar from the left column and move along the horizontal line to the US Dollar, the percentage change displayed in the box will represent AUD (base)/USD (quote).
Economic Indicator
Judo Bank Manufacturing PMI
The Manufacturing Purchasing Managers Index (PMI), released on a monthly basis by Judo Bank and S&P Global, is a leading indicator gauging business activity in Australia’s manufacturing sector. The data is derived from surveys of senior executives at private-sector companies. Survey responses reflect the change, if any, in the current month compared to the previous month and can anticipate changing trends in official data series such as Gross Domestic Product (GDP), industrial production, employment and inflation. The index varies between 0 and 100, with levels of 50.0 signaling no change over the previous month. A reading above 50 indicates that the manufacturing economy is generally expanding, a bullish sign for the Australian Dollar (AUD). Meanwhile, a reading below 50 signals that activity among goods producers is generally declining, which is seen as bearish for AUD.
Read more.Last release: Sun Mar 23, 2025 22:00 (Prel)
Frequency: Monthly
Actual: 52.6
Consensus: -
Previous: 50.4
Source: S&P Global
추천 기사


