
USD/MXN Price Forecast: Resumes downside under 100-day EMA below 20.50
- USD/MXN trades in positive territory around 20.20 in Thursday’s early European session.
- The pair resumes its downside as the pair is below the 100-day EMA with a bearish RSI indicator.
- The first downside target to watch is the 20.10-20.00 region; the immediate resistance level emerges at 20.40.
The USD/MXN pair edges higher to near 20.20 during the early European session on Thursday, bolstered by a modest recovery of the US Dollar (USD). However, Mexico’s strong external accounts, including a trade surplus and robust remittances, might boost the Mexican Peso (MXN) and create a headwind for the pair in the near term.
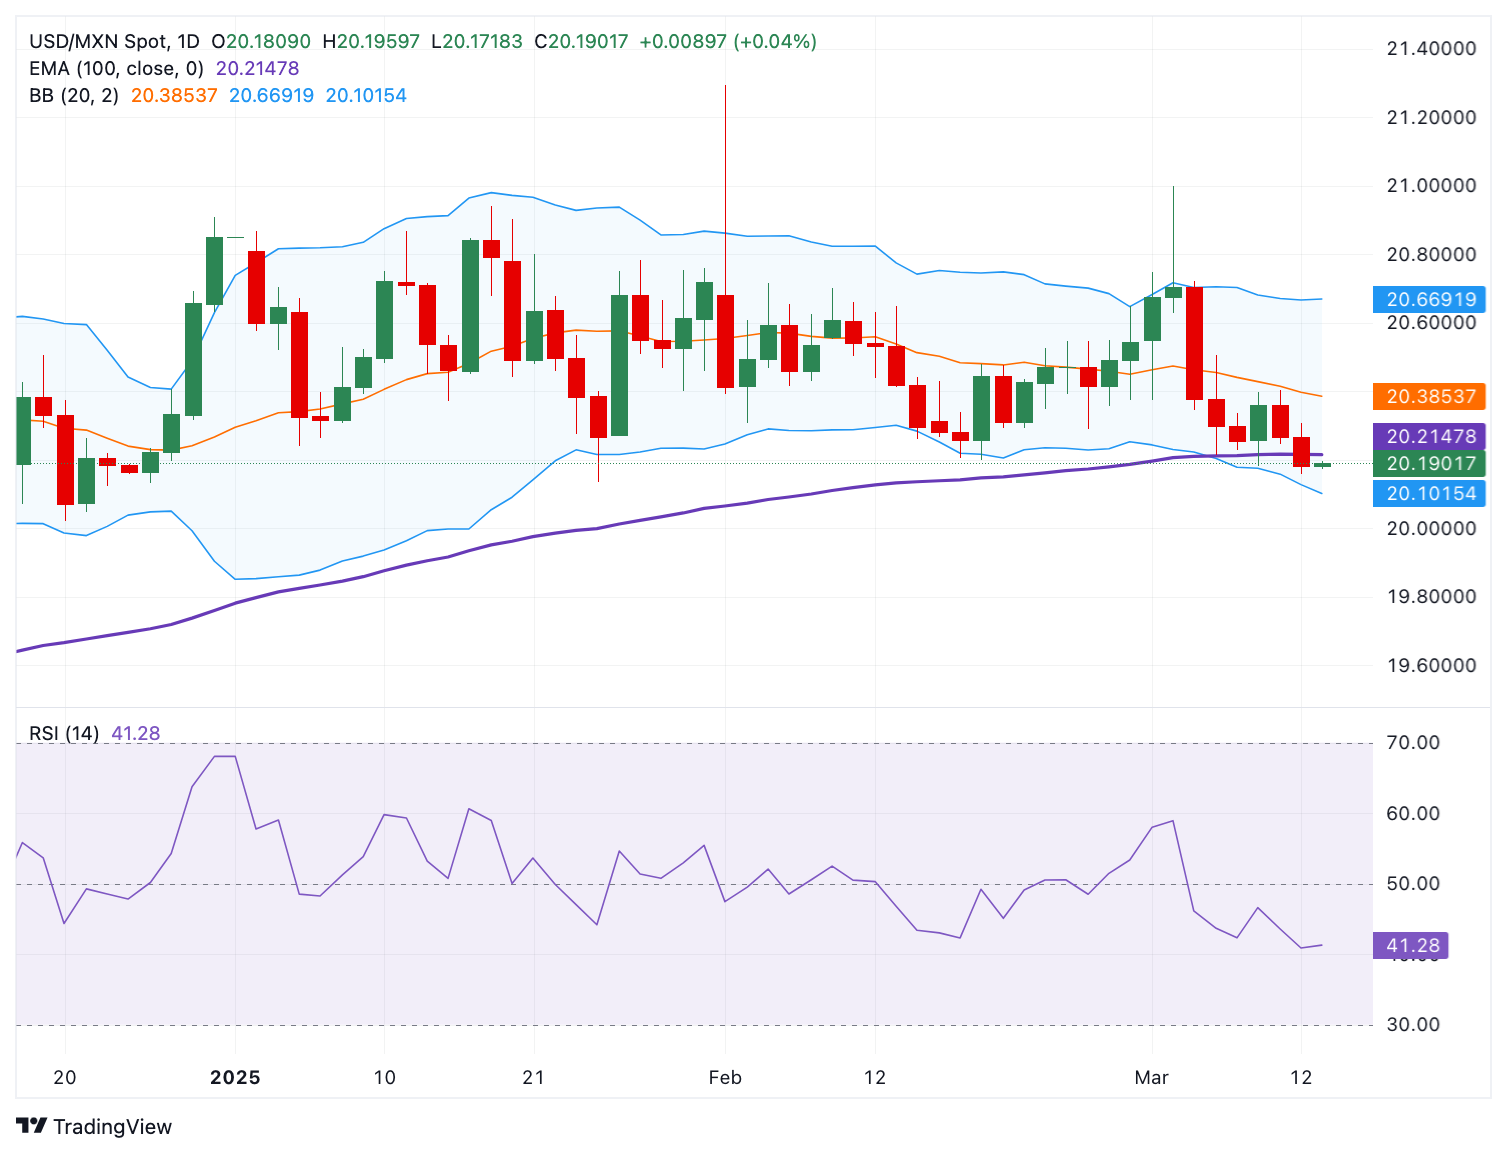
Technically, EUR/USD resumes its downside journey after crossing below the key 100-day Exponential Moving Average (EMA) on the daily chart. Additionally, the downward momentum is supported by the 14-day Relative Strength Index (RSI), which is located below the midline around 41.40, indicating that the path to the least resistance level is to the downside.
The initial support level for USD/MXN emerges at the 20.10-20.00 zone, representing the lower limit of the Bollinger Band and the psychological level. A breach of this level could expose 19.25, the low of October 11, 2024. Extended losses could push prices lower toward 18.60, the low of October 16, 2024.
On the upside, the first upside barrier is seen at 20.40, the high of March 11. Sustained bullish momentum could see a rally to 20.66, the upper boundary of the Bollinger Band. Further north, the next hurdle to watch is the 21.00 psychological level.
USD/MXN daily chart
Mexican Peso FAQs
The Mexican Peso (MXN) is the most traded currency among its Latin American peers. Its value is broadly determined by the performance of the Mexican economy, the country’s central bank’s policy, the amount of foreign investment in the country and even the levels of remittances sent by Mexicans who live abroad, particularly in the United States. Geopolitical trends can also move MXN: for example, the process of nearshoring – or the decision by some firms to relocate manufacturing capacity and supply chains closer to their home countries – is also seen as a catalyst for the Mexican currency as the country is considered a key manufacturing hub in the American continent. Another catalyst for MXN is Oil prices as Mexico is a key exporter of the commodity.
The main objective of Mexico’s central bank, also known as Banxico, is to maintain inflation at low and stable levels (at or close to its target of 3%, the midpoint in a tolerance band of between 2% and 4%). To this end, the bank sets an appropriate level of interest rates. When inflation is too high, Banxico will attempt to tame it by raising interest rates, making it more expensive for households and businesses to borrow money, thus cooling demand and the overall economy. Higher interest rates are generally positive for the Mexican Peso (MXN) as they lead to higher yields, making the country a more attractive place for investors. On the contrary, lower interest rates tend to weaken MXN.
Macroeconomic data releases are key to assess the state of the economy and can have an impact on the Mexican Peso (MXN) valuation. A strong Mexican economy, based on high economic growth, low unemployment and high confidence is good for MXN. Not only does it attract more foreign investment but it may encourage the Bank of Mexico (Banxico) to increase interest rates, particularly if this strength comes together with elevated inflation. However, if economic data is weak, MXN is likely to depreciate.
As an emerging-market currency, the Mexican Peso (MXN) tends to strive during risk-on periods, or when investors perceive that broader market risks are low and thus are eager to engage with investments that carry a higher risk. Conversely, MXN tends to weaken at times of market turbulence or economic uncertainty as investors tend to sell higher-risk assets and flee to the more-stable safe havens.
추천 기사


