
USD/CHF Price Forecast: Bears moved in, eye 200-day SMA
- USD/CHF extends decline below 0.9000, hitting a yearly low.
- RSI signals bearish momentum, with further downside if 0.8800 is breached.
- Next support at 0.8738; upside capped at 0.8900 and 100-day SMA at 0.8924.
The Swiss Franc (CHF) posted solid gains versus the Greenback (USD) on Thursday, despite mixed data showing that the US economy continues to deteriorate. The USD/CHF trades at 0.8835, down over 0.79% late during the North American session.
USD/CHF Price Forecast: Technical outlook
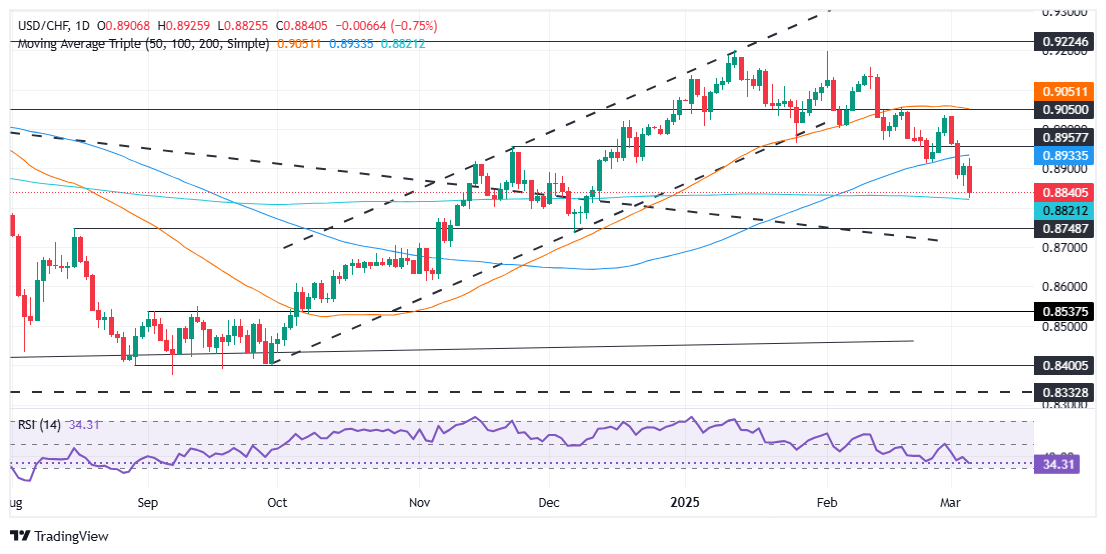
The USD/CHF has been extending its decline below 0.9000 since Monday and fell to a yearly low of 0.8824, shy of testing the 200-day Simple Moving Average (SMA) at 0.8818, which, if cleared, could’ve opened the way to testing 0.8800.
The Relative Strength Index (RSI) shows that bears gather momentum, remaining with enough room before turning oversold. Therefore, if USD/CHF clears the 200-day SMA, further downside lies ahead.
A breach of the 0.8800 mark will expose the December low of 0.8738. On the other hand, if USD/CHF rises above 0.8900, buyers could regain some composure and test the next key resistance at 0.8924, the 100-day SMA, followed by the 0.9000 mark.
USD/CHF Price Chart – Daily
Swiss Franc PRICE Today
The table below shows the percentage change of Swiss Franc (CHF) against listed major currencies today. Swiss Franc was the strongest against the Japanese Yen.
| USD | EUR | GBP | JPY | CAD | AUD | NZD | CHF | |
|---|---|---|---|---|---|---|---|---|
| USD | 0.00% | -0.02% | 0.13% | -0.08% | -0.01% | 0.04% | 0.05% | |
| EUR | 0.00% | -0.02% | 0.16% | -0.08% | -0.01% | 0.05% | 0.04% | |
| GBP | 0.02% | 0.02% | 0.17% | -0.06% | 0.01% | 0.06% | 0.09% | |
| JPY | -0.13% | -0.16% | -0.17% | -0.22% | -0.15% | -0.11% | -0.07% | |
| CAD | 0.08% | 0.08% | 0.06% | 0.22% | 0.07% | 0.12% | 0.16% | |
| AUD | 0.00% | 0.00% | -0.01% | 0.15% | -0.07% | 0.05% | 0.09% | |
| NZD | -0.04% | -0.05% | -0.06% | 0.11% | -0.12% | -0.05% | 0.04% | |
| CHF | -0.05% | -0.04% | -0.09% | 0.07% | -0.16% | -0.09% | -0.04% |
The heat map shows percentage changes of major currencies against each other. The base currency is picked from the left column, while the quote currency is picked from the top row. For example, if you pick the Swiss Franc from the left column and move along the horizontal line to the US Dollar, the percentage change displayed in the box will represent CHF (base)/USD (quote).
추천 기사


