EUR/USD climbs above 1.0500 as ECB’s Schnabel turns hawkish
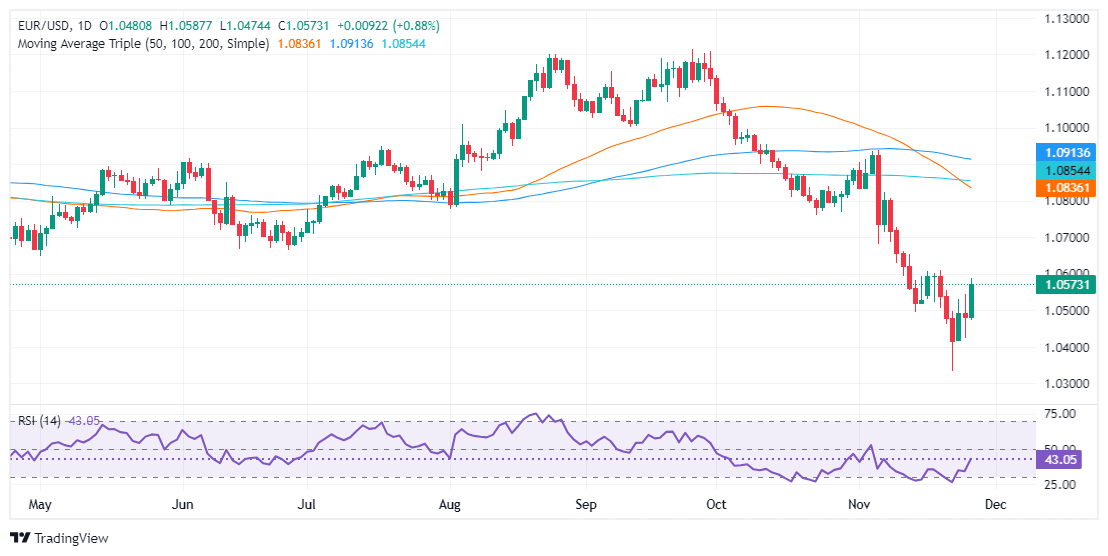
- EUR/USD rises 0.81% to 1.0574, recovering from recent losses, after ECB’s Isabel Schnabel urges caution on accommodative monetary policy.
- US Durable Goods Orders for October beat expectations but missed forecasts for a larger gain, up 0.2% MoM.
- US GDP growth for Q3 rose to 2.8%, in line with expectations, but down from Q2’s 3% growth.
The Euro recovered against the Greenback in the mid-North American session due to hawkish comments by European Central Bank (ECB) member Isabel Schnabel, who said the ECB should not be accommodative on rates. Therefore, the EUR/USD climbed by 0.81% and trades at 1.0574.
EUR/USD gains 0.81% to 1.0574, bolstered by ECB comments
US data failed to underpin the Greenback, which appreciated some 5.50% against the Euro, since the elections. US Durable Goods Orders for the month of October came at 0.2% MoM, exceeding September’s figures, yet missed estimates for a 0.5% expansion. Other data showed that the US Gross Domestic Product (GDP) in its second estimate was 2.8%, as expected, below the second quarter's 3% growth.
At the same time, the US Department of Labor announced that Initial Jobless Claims for the week ending November 23, rose by 213K, unchanged from the previous reading and missed estimates of 217K.
In the meantime, the Federal Reserve’s preferred inflation gauge, the core Personal Consumption Expenditures (PCE) Price Index, was unchanged at 2.8% YoY, up from the previous reading of 2.7%.
Earlier, Germany’s Gfk Consumer Climate index plummeted by -23.3 in November, below estimates. The institute mentioned that consumers have a sharp decline in income expectations and some decline in the willingness to buy, in contrast to an increase in the desire to save
EUR/USD Price Forecast: Technical outlook
The EUR/USD downtrend remains intact, yet price action during the last three days edged higher, an indication that it is not finding acceptance at around the 1.03-1.04 figure. If the pair extends its gains past the November 20 high of 1.0609, buyers could test the 1.0700 figure. Otherwise, a drop beneath 1.0500 could lead to bears challenging the 1.0400 mark.

Euro PRICE Today
The table below shows the percentage change of Euro (EUR) against listed major currencies today. Euro was the strongest against the US Dollar.
| USD | EUR | GBP | JPY | CAD | AUD | NZD | CHF | |
|---|---|---|---|---|---|---|---|---|
| USD | -0.88% | -0.95% | -1.49% | -0.29% | -0.55% | -1.31% | -0.67% | |
| EUR | 0.88% | -0.07% | -0.61% | 0.60% | 0.35% | -0.44% | 0.21% | |
| GBP | 0.95% | 0.07% | -0.54% | 0.67% | 0.40% | -0.36% | 0.29% | |
| JPY | 1.49% | 0.61% | 0.54% | 1.21% | 0.94% | 0.21% | 0.83% | |
| CAD | 0.29% | -0.60% | -0.67% | -1.21% | -0.27% | -1.03% | -0.38% | |
| AUD | 0.55% | -0.35% | -0.40% | -0.94% | 0.27% | -0.76% | -0.12% | |
| NZD | 1.31% | 0.44% | 0.36% | -0.21% | 1.03% | 0.76% | 0.66% | |
| CHF | 0.67% | -0.21% | -0.29% | -0.83% | 0.38% | 0.12% | -0.66% |
The heat map shows percentage changes of major currencies against each other. The base currency is picked from the left column, while the quote currency is picked from the top row. For example, if you pick the Euro from the left column and move along the horizontal line to the US Dollar, the percentage change displayed in the box will represent EUR (base)/USD (quote).

