

Canadian Dollar soften on Monday with CPI data around the corner
- The Canadian Dollar tilted into the red across the board on Monday.
- Canada delivers its latest CPI inflation data this week.
- A speech from BoC’s Macklem and Canadian Retail Sales data due on Friday.
The Canadian Dollar backslid to kick off the trading week, falling into the low end on Monday across the major currency board as CAD traders gear up for a fresh round of Canadian Consumer Price Index (CPI) inflation figures due during the mid-week phase.
Canada releases its latest inflation figures on Tuesday, with the Bank of Canada (BoC) set to deliver their own core CPI basket print at the same time. Later in the week, Canadian Retail Sales figures will be released on Friday, alongside a fresh appearance from BoC head Tiff Macklem. Of course, the key event for global markets this week will be the US Federal Reserve’s (Fed) highly-anticipated rate cut due on Wednesday.
Daily digest market movers
- The Canadian Dollar eased back on quiet Monday flows.
- Canadian MoM CPI inflation due on Tuesday is expected to ease back to 0.1% in August compared to July’s 0.4% print.
- Global markets have pivoted towards the Fed’s upcoming rate call on Wednesday, crimping the likelihood of meaningful chart moves beforehand.
- Market participants are increasingly convinced that the Fed will kick off the next rate cutting cycle with a 50 bps cut on Wednesday with only 40% odds of a 25 bps cut according to the CME’s FedWatch Tool.
- A speech from BoC Governor Macklem and the latest Canadian Retail Sales figures are slated for Friday.
Economic Indicator
BoC Consumer Price Index Core (MoM)
The BoC Consumer Price Index Core, released by the Bank of Canada (BoC) on a monthly basis, represents changes in prices for Canadian consumers by comparing the cost of a fixed basket of goods and services. It is considered a measure of underlying inflation as it excludes eight of the most-volatile components: fruits, vegetables, gasoline, fuel oil, natural gas, mortgage interest, intercity transportation and tobacco products. The MoM figure compares the prices of goods in the reference month to the previous month. Generally, a high reading is seen as bullish for the Canadian Dollar (CAD), while a low reading is seen as bearish.
Read more.Next release: Tue Sep 17, 2024 12:30
Frequency: Monthly
Consensus: -
Previous: 0.3%
Source: Statistics Canada
Canadian Dollar price forecast
The Canadian Dollar (CAD) continues to struggle to come up with reasons to hit the bids, so it simply doesn’t these days. USD/CAD continues to churn away in a technical no-man’s land just below the 200-day Exponential Moving Average (EMA) at 1.3617, and long-term average are grinding steadily toward the 1.36 key technical level as the pair falls into disrepair.
USD/CAD daily chart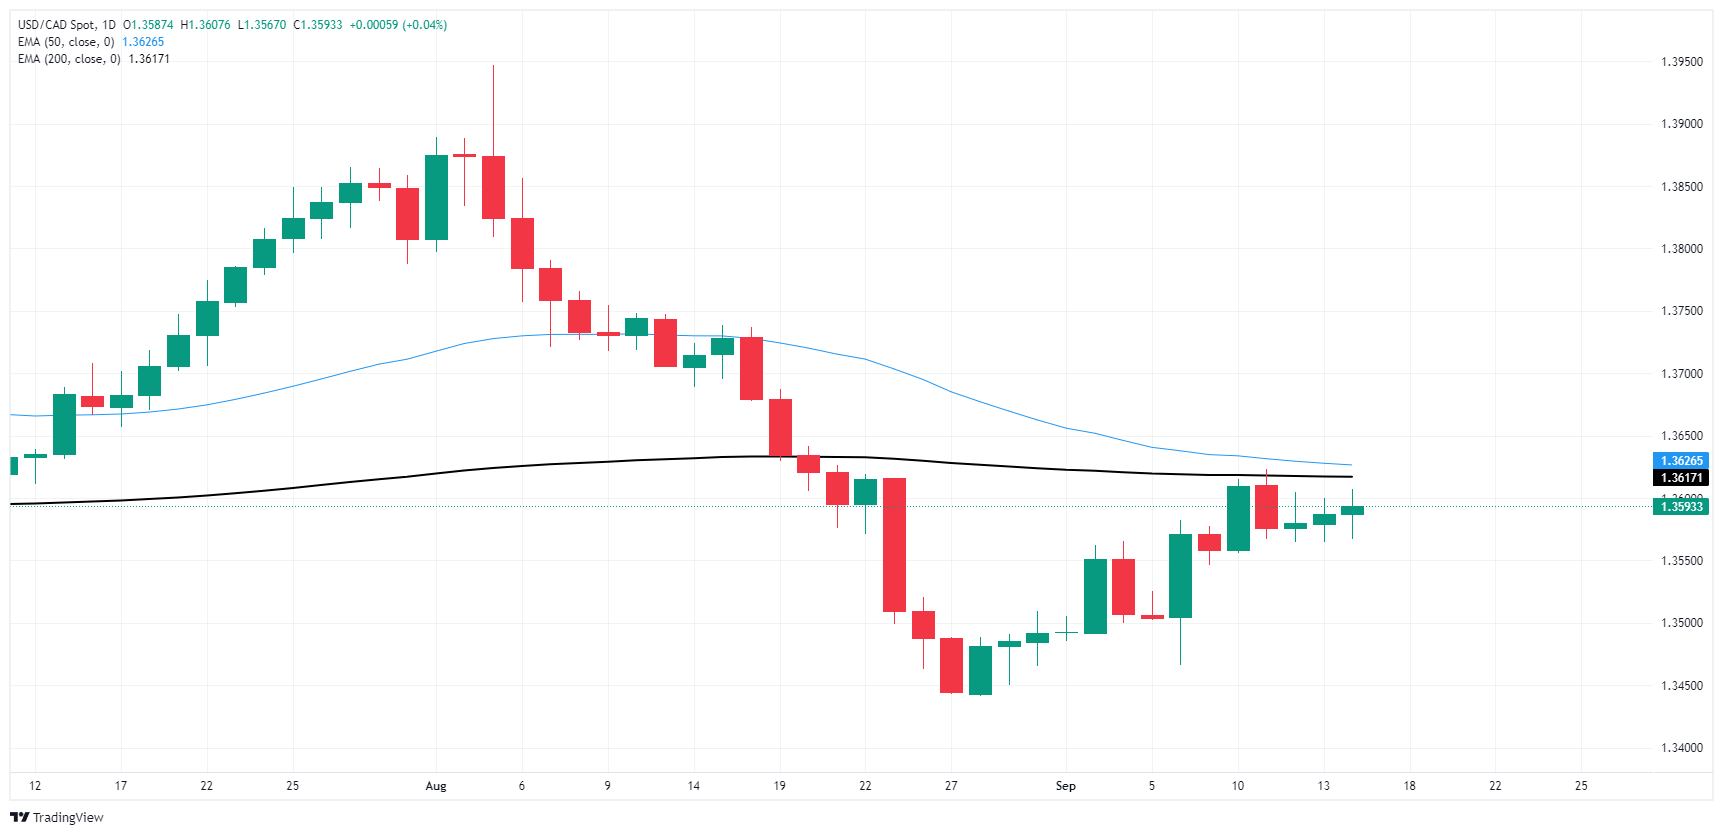
Canadian Dollar FAQs
The key factors driving the Canadian Dollar (CAD) are the level of interest rates set by the Bank of Canada (BoC), the price of Oil, Canada’s largest export, the health of its economy, inflation and the Trade Balance, which is the difference between the value of Canada’s exports versus its imports. Other factors include market sentiment – whether investors are taking on more risky assets (risk-on) or seeking safe-havens (risk-off) – with risk-on being CAD-positive. As its largest trading partner, the health of the US economy is also a key factor influencing the Canadian Dollar.
The Bank of Canada (BoC) has a significant influence on the Canadian Dollar by setting the level of interest rates that banks can lend to one another. This influences the level of interest rates for everyone. The main goal of the BoC is to maintain inflation at 1-3% by adjusting interest rates up or down. Relatively higher interest rates tend to be positive for the CAD. The Bank of Canada can also use quantitative easing and tightening to influence credit conditions, with the former CAD-negative and the latter CAD-positive.
The price of Oil is a key factor impacting the value of the Canadian Dollar. Petroleum is Canada’s biggest export, so Oil price tends to have an immediate impact on the CAD value. Generally, if Oil price rises CAD also goes up, as aggregate demand for the currency increases. The opposite is the case if the price of Oil falls. Higher Oil prices also tend to result in a greater likelihood of a positive Trade Balance, which is also supportive of the CAD.
While inflation had always traditionally been thought of as a negative factor for a currency since it lowers the value of money, the opposite has actually been the case in modern times with the relaxation of cross-border capital controls. Higher inflation tends to lead central banks to put up interest rates which attracts more capital inflows from global investors seeking a lucrative place to keep their money. This increases demand for the local currency, which in Canada’s case is the Canadian Dollar.
Macroeconomic data releases gauge the health of the economy and can have an impact on the Canadian Dollar. Indicators such as GDP, Manufacturing and Services PMIs, employment, and consumer sentiment surveys can all influence the direction of the CAD. A strong economy is good for the Canadian Dollar. Not only does it attract more foreign investment but it may encourage the Bank of Canada to put up interest rates, leading to a stronger currency. If economic data is weak, however, the CAD is likely to fall.
추천 기사


