

AUD/USD Price Forecast: Holds key support of 20-day EMA
- AUD/USD falls to near 0.6700 as Aussie growth worries weigh on the Australian Dollar.
- Soft US PPI has renewed debate for potential Fed interest rate cut size.
- AUD/USD recovers from 38.2% Fibo retracement.
The AUD/USD pair corrects to near the round-level support of 0.6700 in Friday’s European session. The Aussie asset declines as the Australian Dollar (AUD) weakens amid growing worries over Australia’s economic growth due to the maintenance of high interest rates by the Reserve Bank of Australia (RBA).
Market experts worry that a long RBA hawkish interest rate stance could deteriorate labor market conditions. However, RBA officials continue to support maintaining their Official Cash Rate (OCR) higher as the battle against inflationary pressures is far from over.
Meanwhile, the US Dollar (USD) is also underperforming against its major peers as softer-than-expected United States (US) annual Producer Price Index (PPI) data for August has brought the debate over the likely interest rate cut to size by the Federal Reserve (Fed) back on the table. Market speculation for the Fed to start reducing interest rates aggressively from Thursday has strengthened. The CME FedWatch tool shows that the probability of the Fed reducing interest rates by 50 basis points (bps) to 4.75%-5.00% in September has increased sharply to 43%.
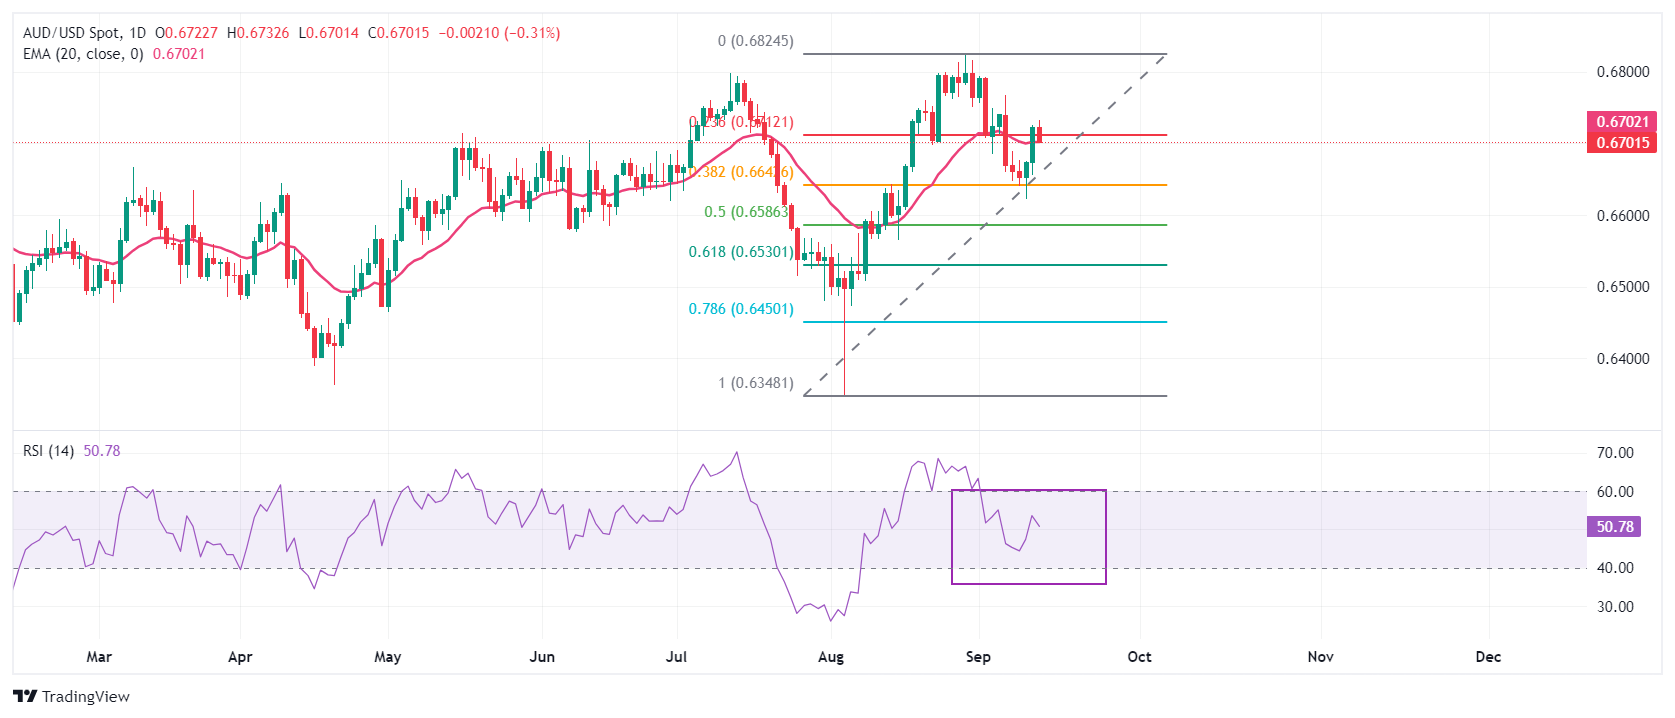
AUD/USD bounces back sharply after retracing 38.2% of the last swing high (plotted from August 5 low near 0.6350 to August 29 high of 0.6824) at 0.6643 on a daily timeframe. The asset has mildly corrected but is holding the key 20-day Exponential Moving Average (EMA), which trades around 0.6700.
The 14-day Relative Strength Index (RSI) oscillates in the 40.00-60.00 range, suggesting a sideways trend ahead.
The Aussie asset would witness a fresh upside move if it breaks above the September 6 high of 0.6767, which will drive the asset toward the round-level resistance of 0.6800 and the Year-To-Date (YTD) high of 0.6840.
On the flip side, a downside move below the weekly low of 0.6622 will drag the asset towards a 50% Fibonacci retracement at 0.6587, followed by an August 6 high of 0.6542.
AUD/USD daily chart
Australian Dollar FAQs
One of the most significant factors for the Australian Dollar (AUD) is the level of interest rates set by the Reserve Bank of Australia (RBA). Because Australia is a resource-rich country another key driver is the price of its biggest export, Iron Ore. The health of the Chinese economy, its largest trading partner, is a factor, as well as inflation in Australia, its growth rate and Trade Balance. Market sentiment – whether investors are taking on more risky assets (risk-on) or seeking safe-havens (risk-off) – is also a factor, with risk-on positive for AUD.
The Reserve Bank of Australia (RBA) influences the Australian Dollar (AUD) by setting the level of interest rates that Australian banks can lend to each other. This influences the level of interest rates in the economy as a whole. The main goal of the RBA is to maintain a stable inflation rate of 2-3% by adjusting interest rates up or down. Relatively high interest rates compared to other major central banks support the AUD, and the opposite for relatively low. The RBA can also use quantitative easing and tightening to influence credit conditions, with the former AUD-negative and the latter AUD-positive.
China is Australia’s largest trading partner so the health of the Chinese economy is a major influence on the value of the Australian Dollar (AUD). When the Chinese economy is doing well it purchases more raw materials, goods and services from Australia, lifting demand for the AUD, and pushing up its value. The opposite is the case when the Chinese economy is not growing as fast as expected. Positive or negative surprises in Chinese growth data, therefore, often have a direct impact on the Australian Dollar and its pairs.
Iron Ore is Australia’s largest export, accounting for $118 billion a year according to data from 2021, with China as its primary destination. The price of Iron Ore, therefore, can be a driver of the Australian Dollar. Generally, if the price of Iron Ore rises, AUD also goes up, as aggregate demand for the currency increases. The opposite is the case if the price of Iron Ore falls. Higher Iron Ore prices also tend to result in a greater likelihood of a positive Trade Balance for Australia, which is also positive of the AUD.
The Trade Balance, which is the difference between what a country earns from its exports versus what it pays for its imports, is another factor that can influence the value of the Australian Dollar. If Australia produces highly sought after exports, then its currency will gain in value purely from the surplus demand created from foreign buyers seeking to purchase its exports versus what it spends to purchase imports. Therefore, a positive net Trade Balance strengthens the AUD, with the opposite effect if the Trade Balance is negative.
추천 기사


