

Top 3 meme coins Dogecoin, Shiba Inu suffer price decline, Bonk price rallies
- Dogecoin takes a hit amidst bearish on-chain metrics, a decline in active addresses and transaction volume.
- Shiba Inu suffers decline in price as supply on exchanges rises by 1.39 trillion, on-chain activity lags.
- Bonk added nearly 5% value on Tuesday amidst low volume, slight increase in social dominance.
Dogecoin (DOGE) and Shiba Inu (SHIB) decline on Tuesday amidst bearish on-chain metrics, as seen on Santiment. On the other hand, Bonk (BONK) price rallies amidst bullish technical indicators on its daily chart.
DOGE has seen a decline in its active addresses, social dominance and transaction volume in the past 10 days. Similar observations are made in SHIB and BONK, per the crypto intelligence tracker Santiment’s data.
Dogecoin wipes recent gains, notes decline in on-chain activity
Between May 18 and May 28, active addresses, transaction volume and social dominance in DOGE decreased, as seen on Santiment. On-chain metrics like active addresses and transaction volume are used to track user activity in an asset, and social dominance measures the share of an asset’s discussions among crypto discussions on social media platforms like X.
DOGE’s declining on-chain activity and social dominance signal a waning interest among market participants, fueling a bearish narrative for the meme coin.
 [11.53.30, 28 May, 2024]-638524922601283251.png)
Dogecoin price, active addresses, social dominance and transaction volume
DOGE wipes out nearly 2% of its value on Tuesday and is likely to find support at the May 24 low of $0.1550. Further down, DOGE could sweep liquidity at $0.1475, the May 19 and 20 lows region. However, if Dogecoin sees a daily candlestick close above the $0.1744 level, it could invalidate the bearish thesis.
On the DOGE/USDT daily chart, the momentum indicators Moving Average Convergence Divergence (MACD) and Relative Strength Index (RSI) support DOGE price gains. RSI reads 54.44, above the neutral level of 50 and signaling slightly bullish momentum, and MACD shows green histogram bars above the neutral line, implying underlying positive momentum in DOGE.
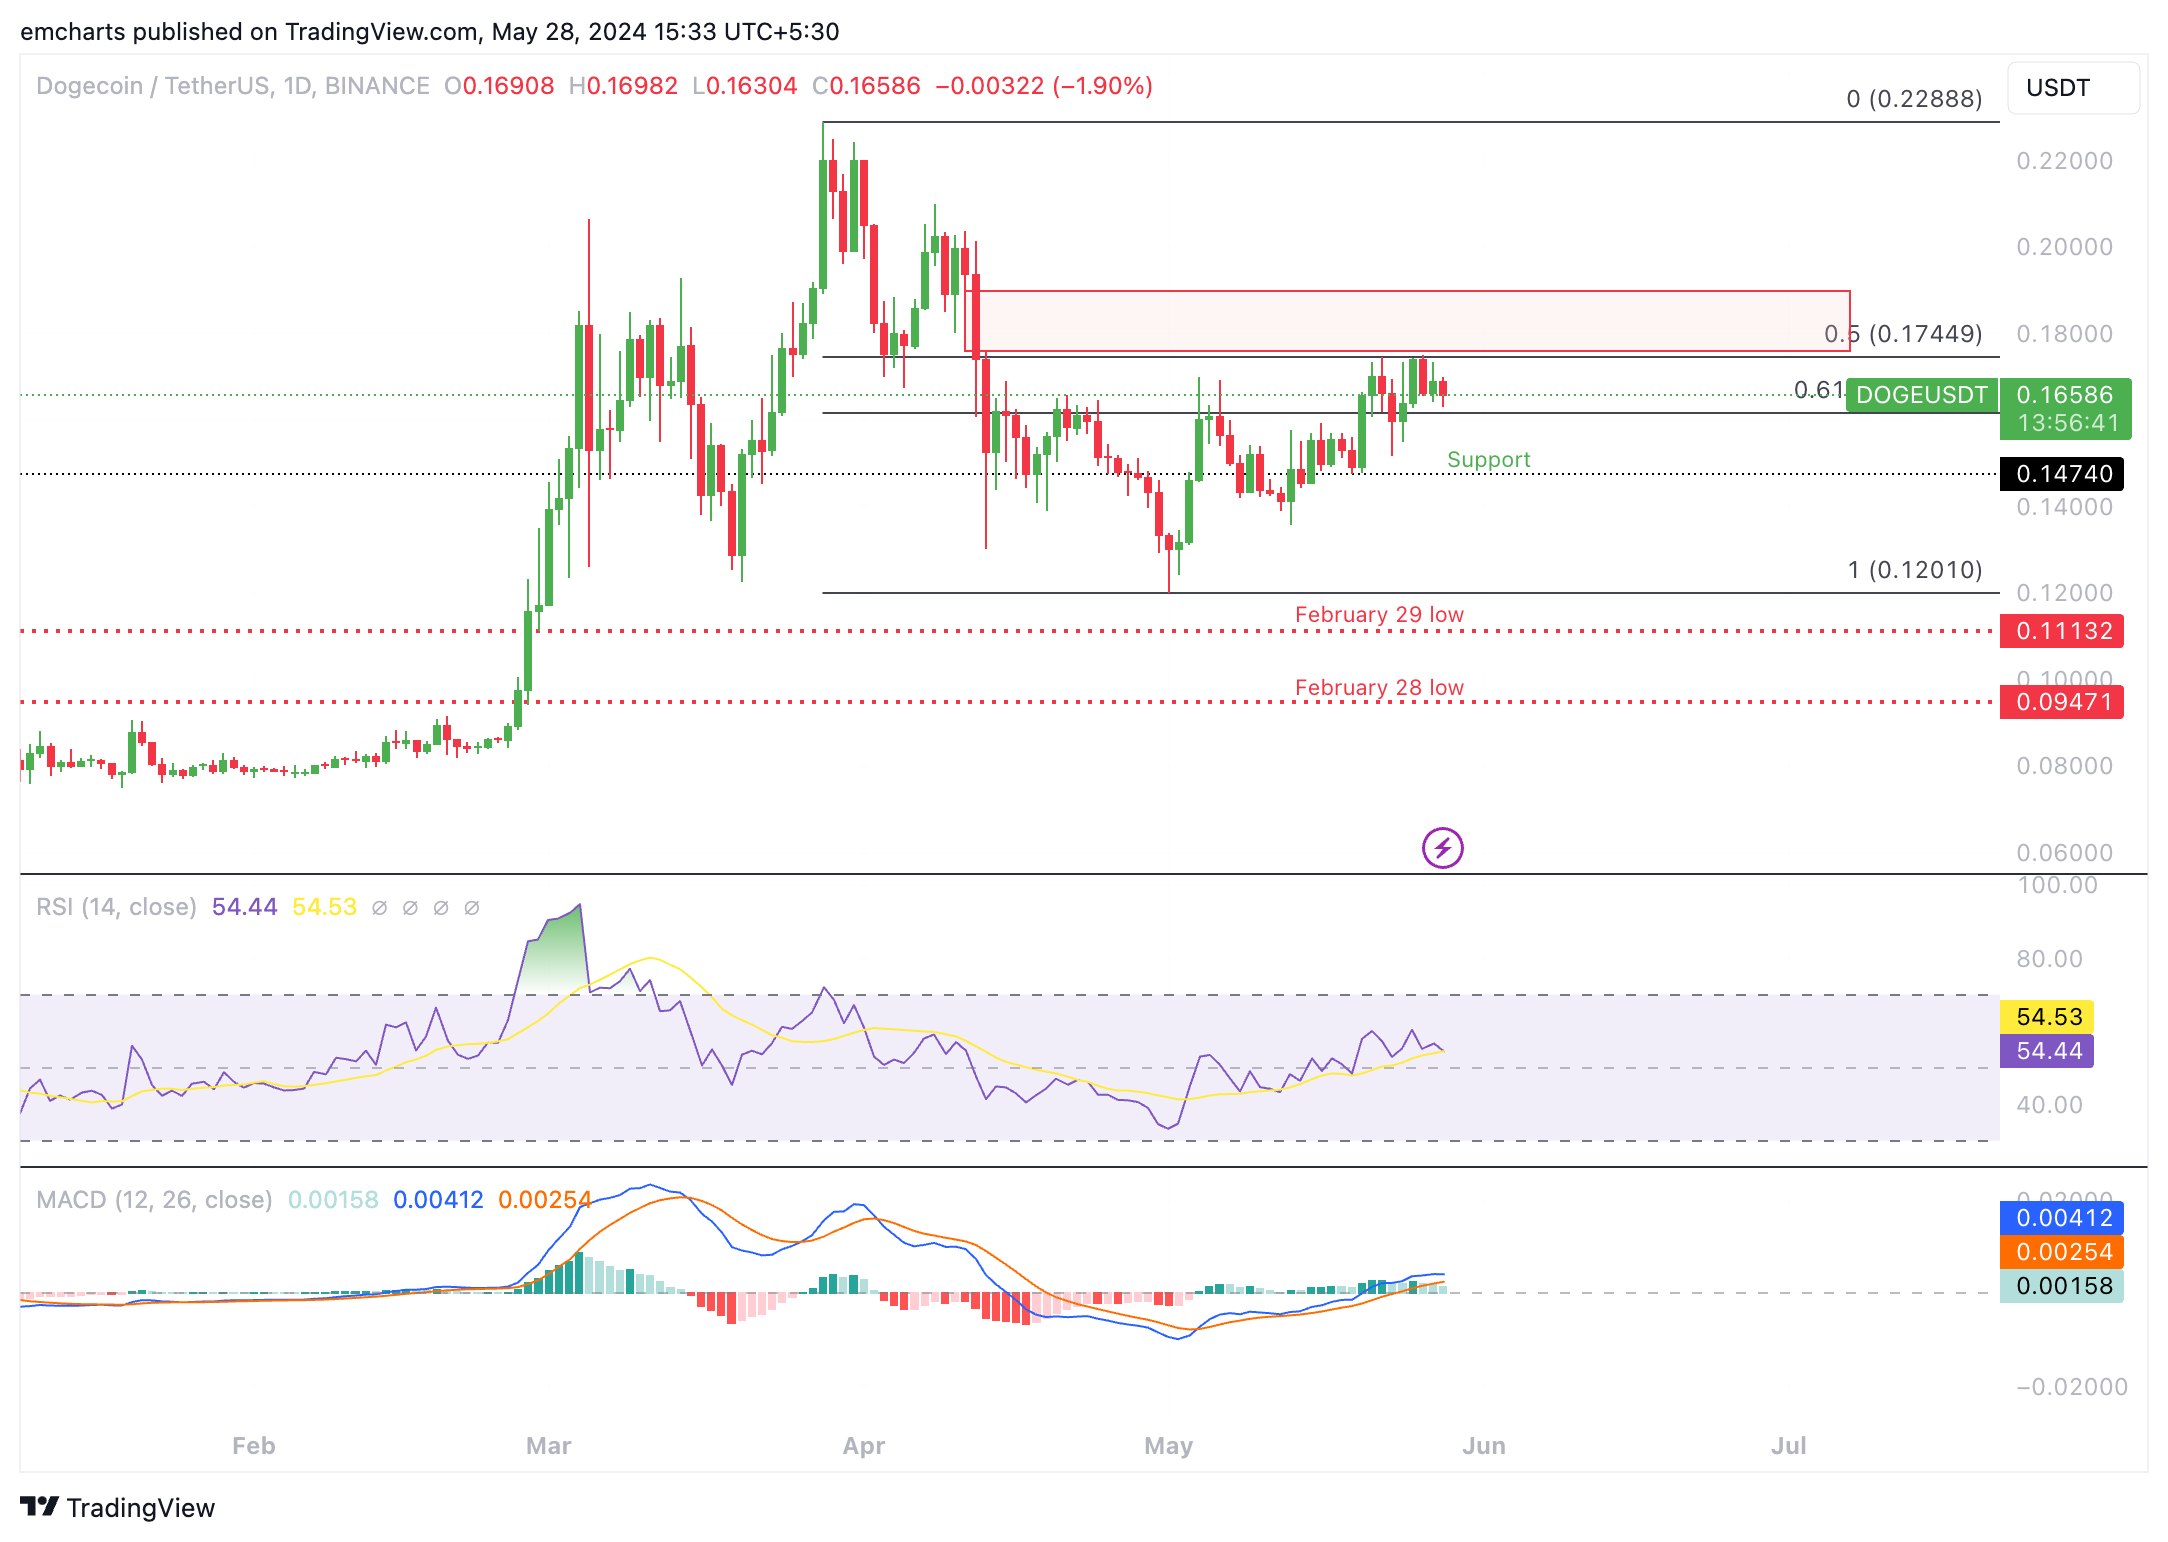
DOGE/USDT daily chart
Shiba Inu supply on exchanges climbs, SHIB could extend losses
Shiba Inu supply on exchanges climbed by 1.30 trillion between May 18 and 28, according to data from Santiment. Typically, a rise in exchange supply is considered indicative of higher selling pressure on the asset.
 [12.01.35, 28 May, 2024]-638524923845868664.png)
Shiba Inu price and supply on exchanges
SHIB/USDT daily chart shows that Shiba Inu could rally towards the May 22 high at $0.00002686, over a 5% rise from the current level. The momentum indicators on the daily timeframe support the bullish thesis as RSI reads 54.99 and the MACD crossed over the signal line on May 14, signaling underlying positive momentum in SHIB’s uptrend.
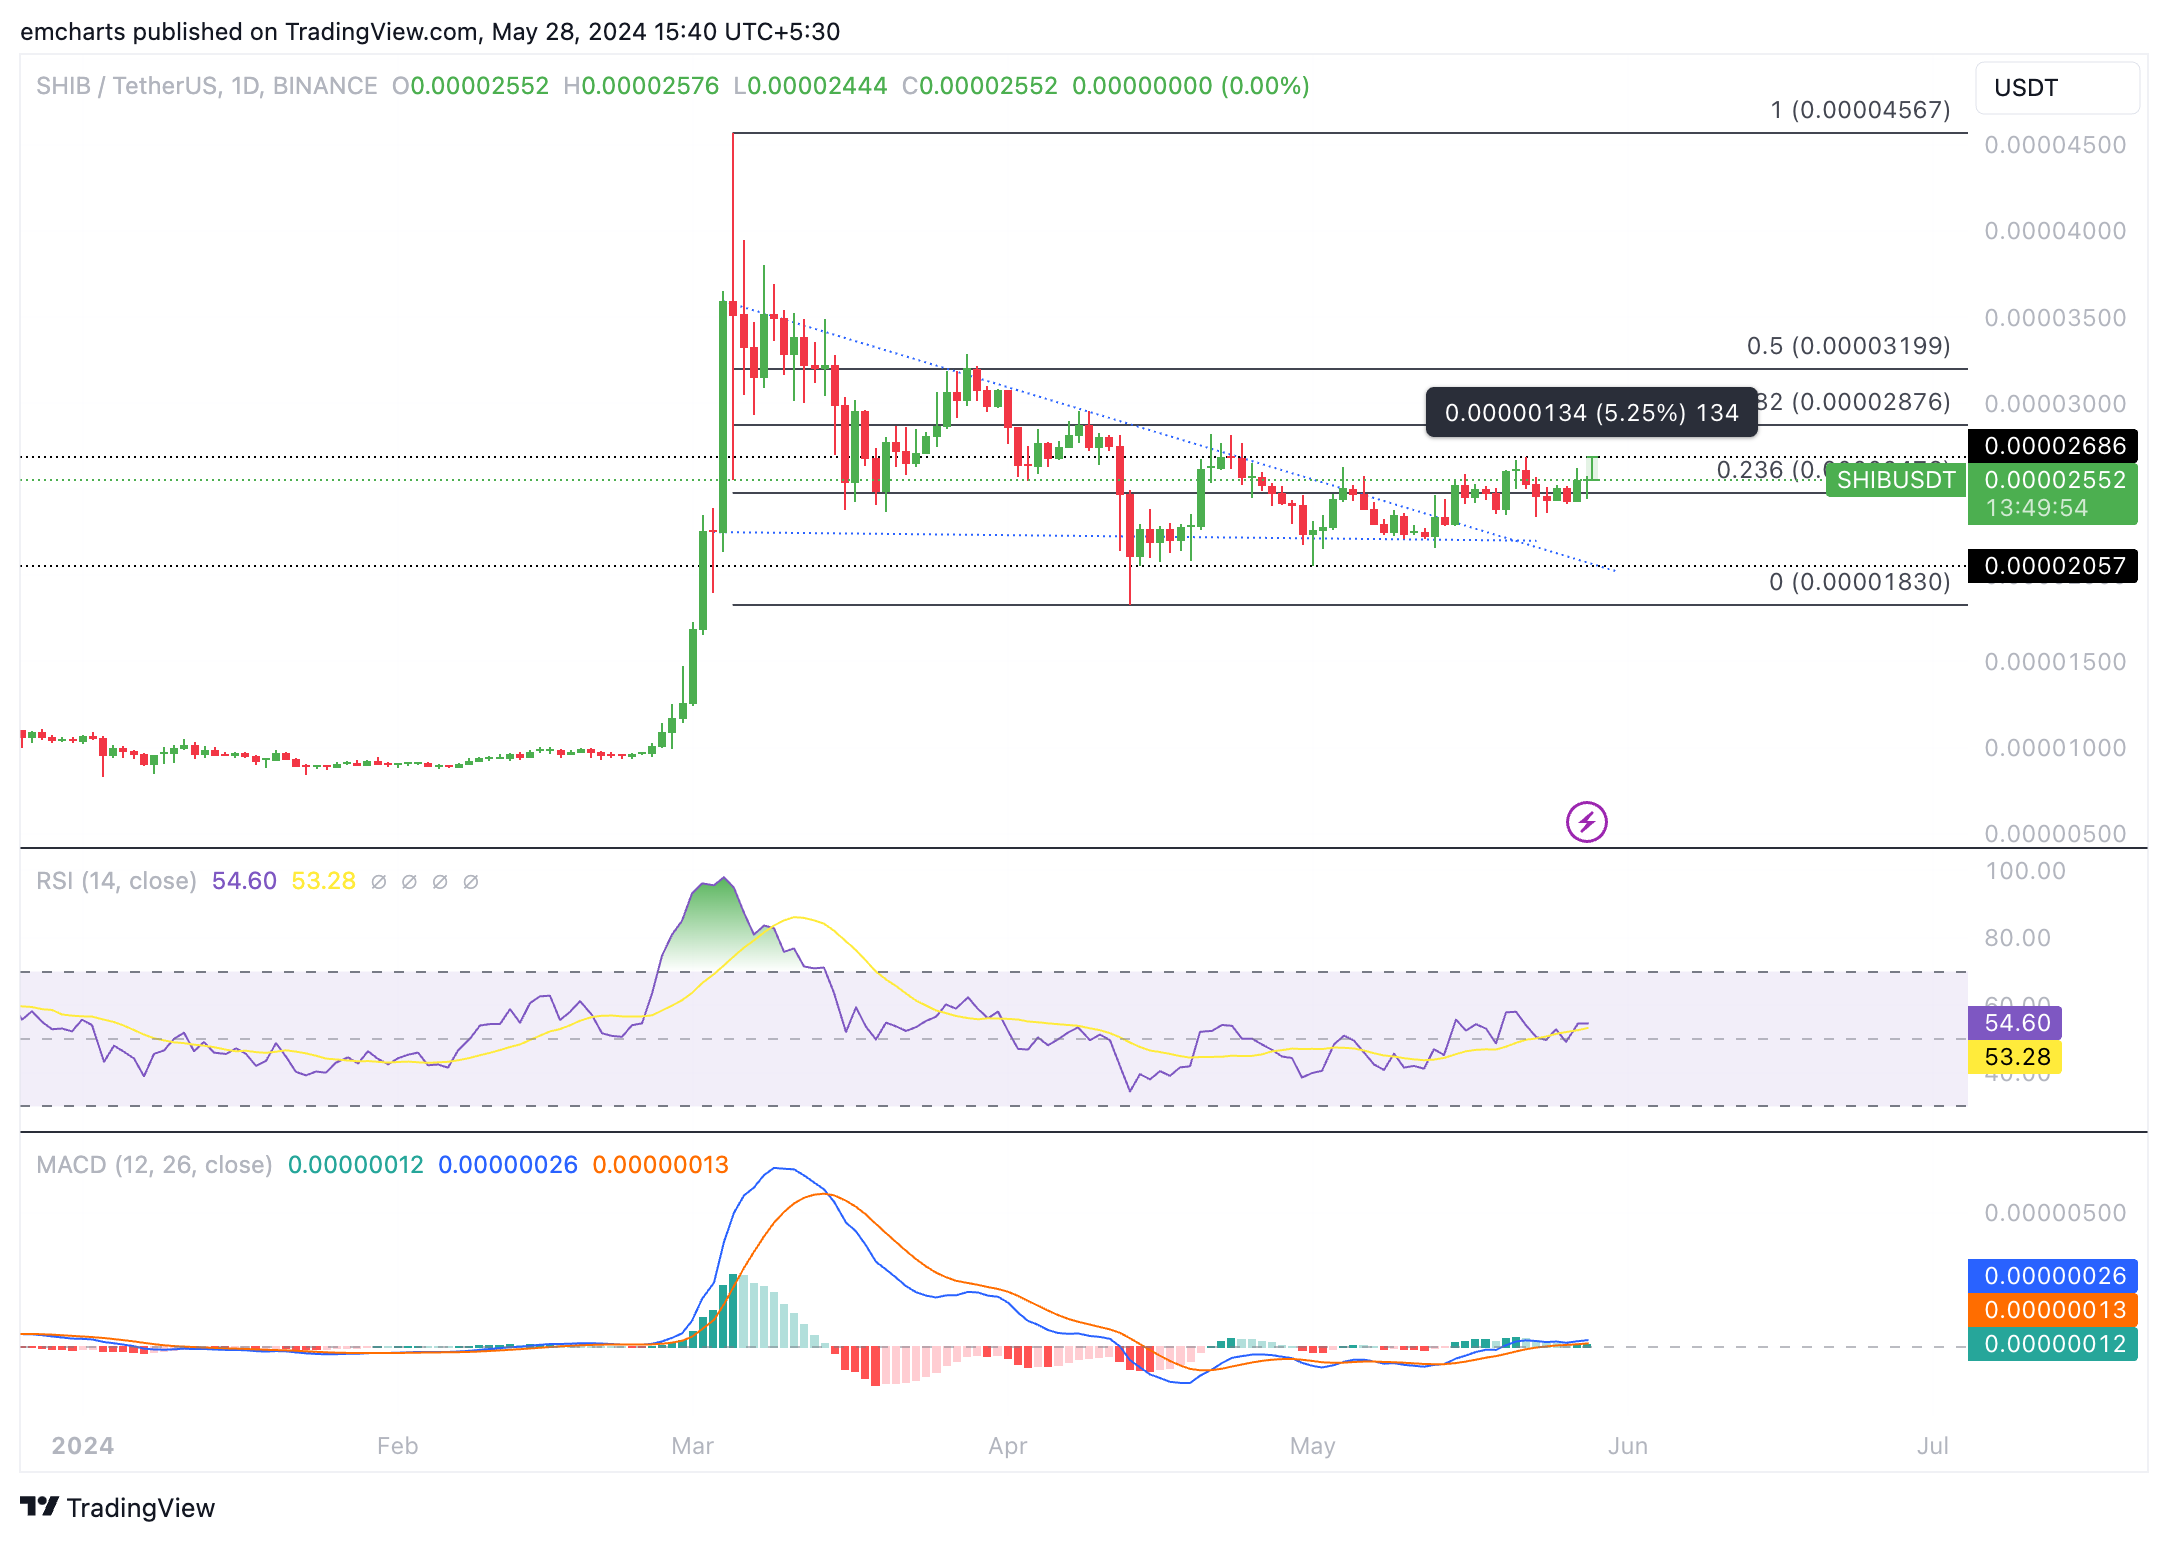
SHIB/USDT daily chart
Shiba Inu wipes out nearly 3% of its value on Tuesday, amidst bearish on-chain metrics and bullish technical indicators.
Bonk sees rise in social dominance, decline in volume
Bonk has noted a divergence in its on-chain metrics, as while volume is on a decline, there is an increase in social dominance. BONK is gaining relevance among market participants, despite decline in on-chain activity. BONK price surges nearly 5% on the day.
 [13.49.22, 28 May, 2024]-638524925292655469.png)
Bonk price, social dominance and volume
BONK could extend gains and retest its March 4 peak of $0.000048, more than 15% away from the current price. The meme coin’s momentum indicator MACD on the daily time frame supports a bullish thesis.
The RSI shows BONK is overbought, so traders need to be cautious when opening a long position in BONK since the meme coin is likely to face a price correction.
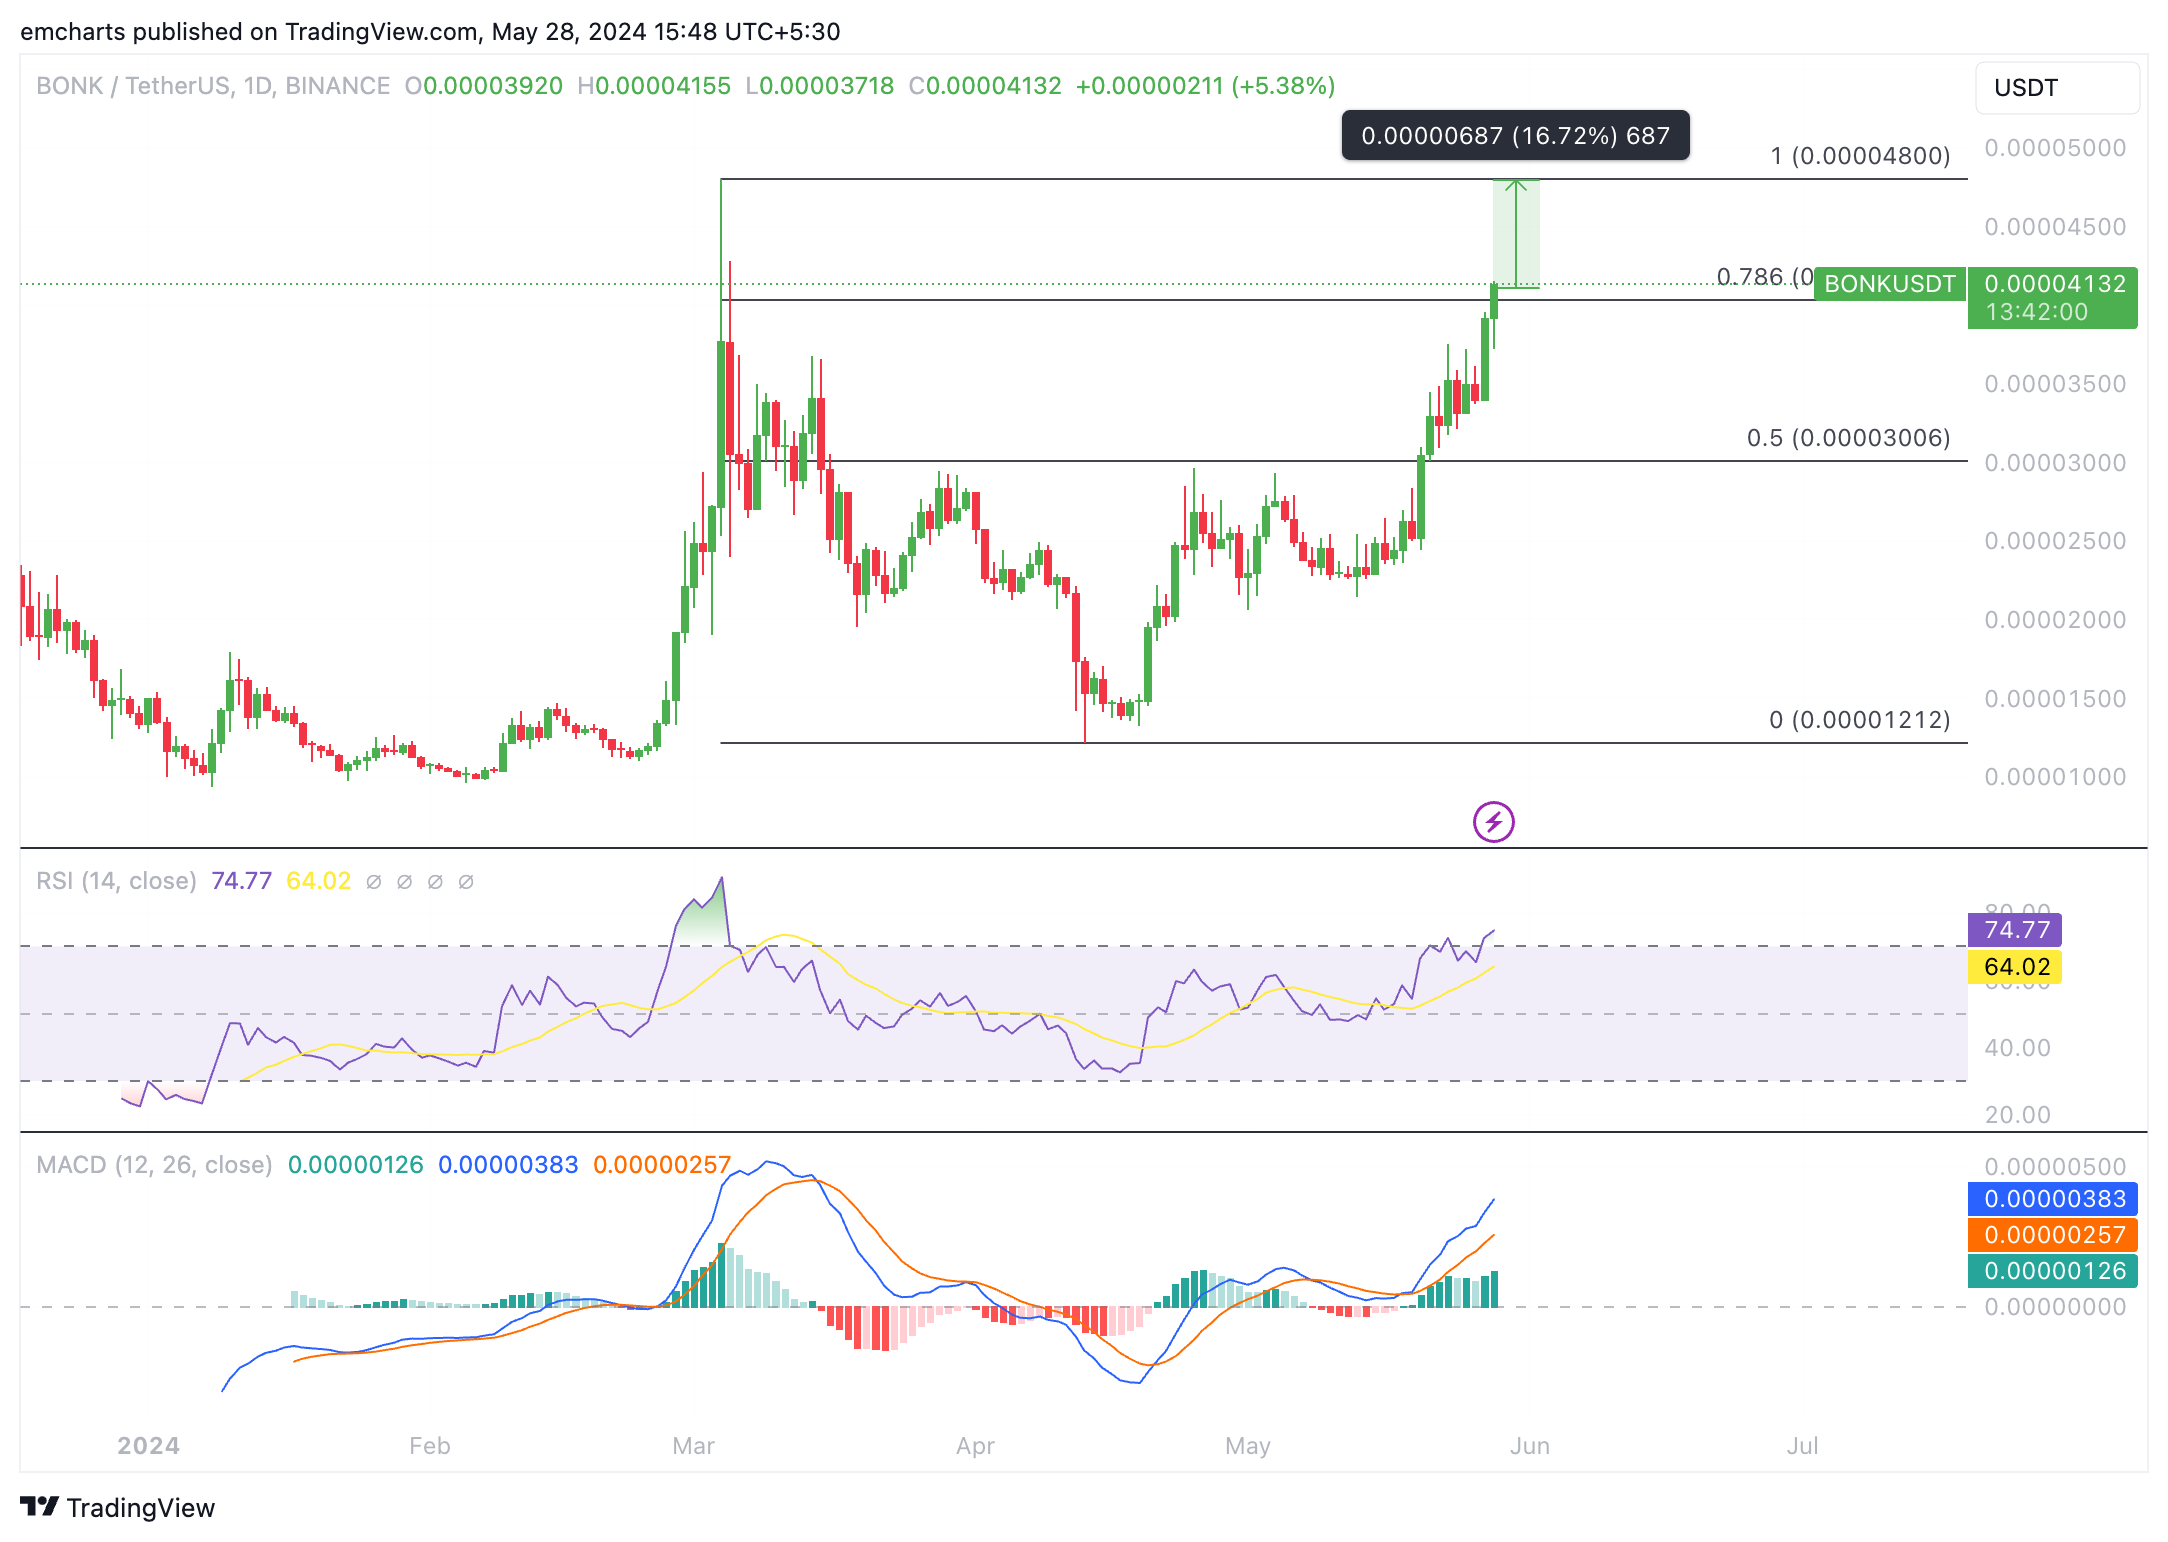
BONK/USDT daily chart
Looking down, BONK could test support at $0.000040, the 78.6% Fibonacci retracement of the decline between March 4 top of $0.000048 and the April 13 low of $0.000012.
Empfohlene Artikel


