EUR/GBP Price Forecast: Finds temporary support at the bottom of a range

Quelle Fxstreet
  • EUR/GBP has touched down on support from the bottom of a range. 
  • It is converging with momentum and could be about to pullback. 

EUR/GBP has extended its break out of a rising channel and fallen to the major support level at 0.8385, which lies at the bottom of a broader range for the pair. 

EUR/GBP Daily Chart 

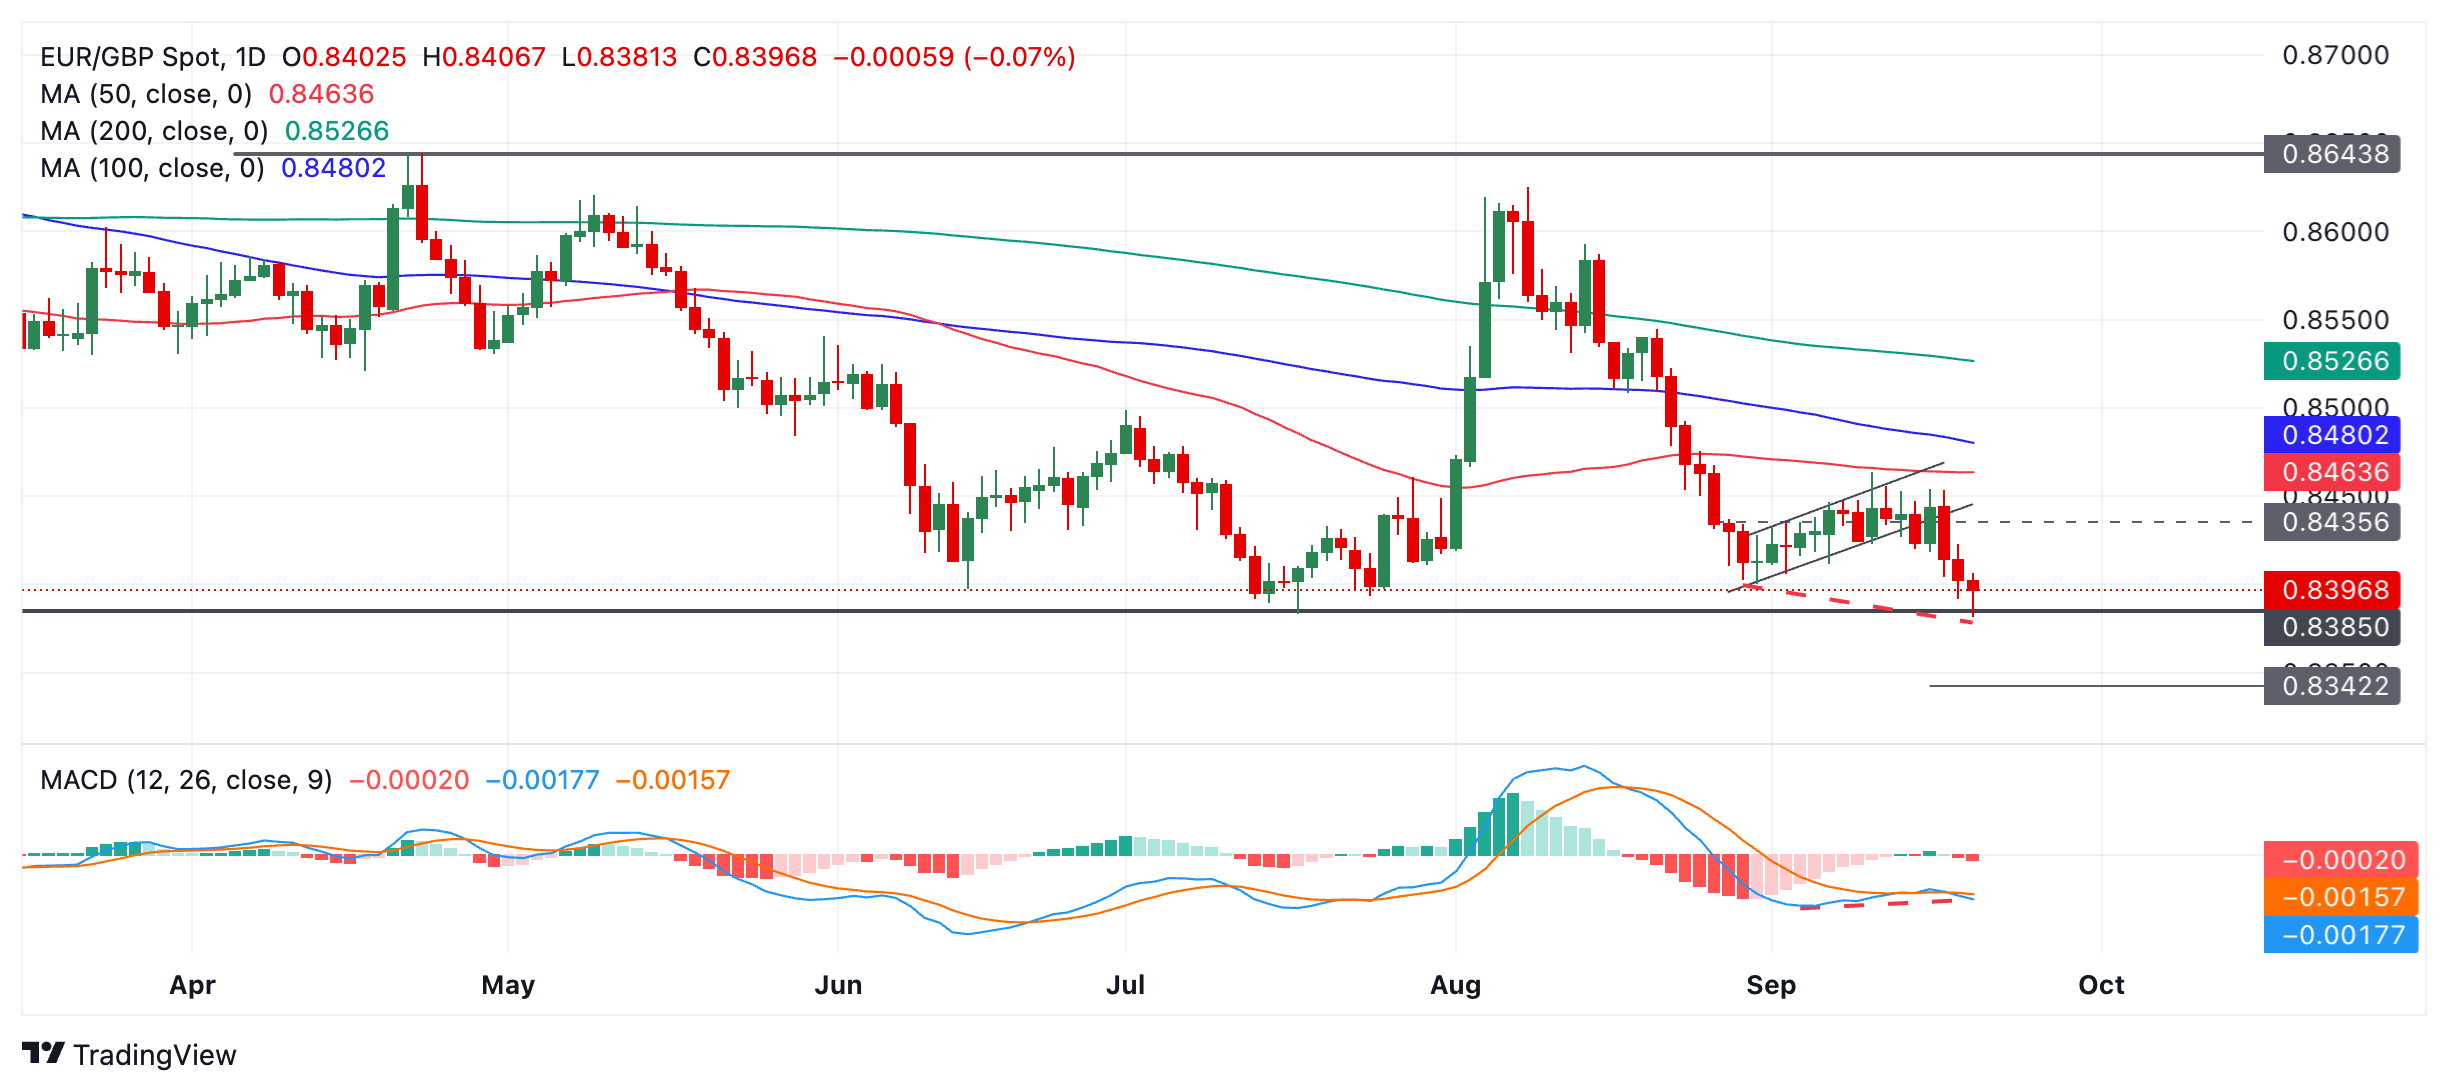
The trend is bearish both in the short and medium-term and given the principle that “the trend is your friend” this means the odds favor more downside. A close below 0.8380 would provide confirmation of a continuation lower to a probable target at 0.8342, the 61.8% Fibonacci extrapolation of the prior down move. 

At the same time bears should be cautious. There are growing signs the EUR/GBP might be bottoming. 

Firstly the pair has reached a solid level of historic support at the base of its range.  

Secondly, the most recent move down over the last few days has been accompanied by relatively weak momentum. Price is now showing bullish convergence with the Moving Average Convergence Divergence (MACD) momentum indicator (red dashed lines). This happens when price falls to a new low but momentum does not match. This is so if the MACD level at the August 29 bottom is compared to the MACD at the September 20 bottom. The price has declined over time but the MACD has not. The convergence is a sign a pullback higher might form. 

Thirdly, EUR/GBP is forming a bullish hammer candlestick on September 20 (today) and this could also suggest a near-term reversal is in the offing, however, this is provisional and depends on the final level of the day’s close. 


Haftungsausschluss: Nur zu Informationszwecken. Die bisherige Performance ist kein verlässlicher Indikator für zukünftige Ergebnisse.
placeholder
Bitcoin, Ethereum und Ripple im freien Fall – Wo liegt der Boden?Bitcoin fällt auf 72.945 $(Tief seit Nov. 2024), Ethereum testet 2.110$. Chartanalyse zu Fibonacci-Levels, RSI-Überverkauftheit und Kurszielen.
Autor  Mitrade Team
Mi. 04.Feb
Bitcoin fällt auf 72.945 $(Tief seit Nov. 2024), Ethereum testet 2.110$. Chartanalyse zu Fibonacci-Levels, RSI-Überverkauftheit und Kurszielen.
placeholder
XRP bei 1,60 Dollar: Diese Ripple-Marke entscheidet jetzt über Crash oder ComebackRipple (XRP) steht am Donnerstag genau dort, wo sich entscheidet, ob die Korrektur vorbei ist oder erst richtig beginnt.
Autor  FXStreet
Do. 05.Feb
Ripple (XRP) steht am Donnerstag genau dort, wo sich entscheidet, ob die Korrektur vorbei ist oder erst richtig beginnt.
placeholder
MicroStrategy-Desaster: 12,6 Milliarden Dollar Verlust – Bitcoin-Wette wird zum historischen MilliardengrabMicroStrategy (MSTR) meldet 12,6 Mrd. $Verlust in Q4 2025. Bitcoin-Bestände (713k BTC) rutschen tief ins Minus (unter Cost Basis von 76k$). Aktie verliert 17%.
Autor  Mitrade Team
Fr. 06.Feb
MicroStrategy (MSTR) meldet 12,6 Mrd. $Verlust in Q4 2025. Bitcoin-Bestände (713k BTC) rutschen tief ins Minus (unter Cost Basis von 76k$). Aktie verliert 17%.
placeholder
Der 2,6-Milliarden-Dollar-Crash: Bitcoin testet 60.000 – "Extreme Angst" lähmt den Markt2,6 Mrd. $liquidiert, Bitcoin testet 60.000$. Ursachen: ETF-Abflüsse, MicroStrategy-Verlust, Bessents "No Bailout"-Ansage und Geopolitik.
Autor  Mitrade Team
Fr. 06.Feb
2,6 Mrd. $liquidiert, Bitcoin testet 60.000$. Ursachen: ETF-Abflüsse, MicroStrategy-Verlust, Bessents "No Bailout"-Ansage und Geopolitik.
placeholder
Solana-Ausverkauf: Kurs fällt unter 70 Dollar – Anleger flüchten in ScharenSOL fällt auf 67,50 $ (-23% diese Woche). Open Interest kollabiert auf 5 Mrd. $, RSI extrem überverkauft (19). Kursziel der Bären: 60 $.
Autor  Mitrade Team
Fr. 06.Feb
SOL fällt auf 67,50 $ (-23% diese Woche). Open Interest kollabiert auf 5 Mrd. $, RSI extrem überverkauft (19). Kursziel der Bären: 60 $.
verbundene Finanzinstrumente
goTop
quote