


GBP/JPY tumbles on Monday, tests 180.00
- GBP/JPY fell 2% on Monday as market sentiment sours.
- Guppy extended into a fifth straight daily decline.
- Risk-off flows bolster Yen despite upbeat UK data print.
GBP/JPY took a dive on Monday, falling over 2% through the day’s market sessions and testing the 180.00 handle before a meager recovery in the back half of the trading day left bids floundering near 183.80.
The pair is down nearly 13.5% from 16-year highs set above 208.00 in July, and the Guppy’s steep correction was kicked off by a series of “Yenterventions” from the Bank of Japan (BoJ) on behalf of the battered Yen. The thing that finally gave the Yen a leg to stand on was last week’s slim rate hike from the BoJ, which finally helped to ease the wide rate differential that has been weighing down the JPY.
A rate cut from the Bank of England (BoE) last week also helped to crimp the Guppy’s rate differential, forcing a stem-to-stern rebalance in market flows through the GBP/JPY.
The economic calendar remains limited for the remains of the week as both the GBP and the JPY get a breather from large-scale momentum swings, even as broad markets pile into safe havens on a shaky Monday.
GBP/JPY technical outlook
The Guppy is down 13.5% from multi-year peaks above 208.00, with price action smashing through the 200-day Exponential Moving Average (EMA) at 192.57 and hitting the brakes just above the 180.00 handle. Bids are holding steady near 184.00 as Tuesday markets get set to come online.
Daily candlesticks have closed deeply in the red for a fifth straight trading day, and has fallen for all but five of the last 17 consecutive market days. Momentum is finally tilted firmly in the bearish side, but a technical recovery could see bidders stepping back into markets as prices bounce back towards 190.00.
GBP/JPY daily chart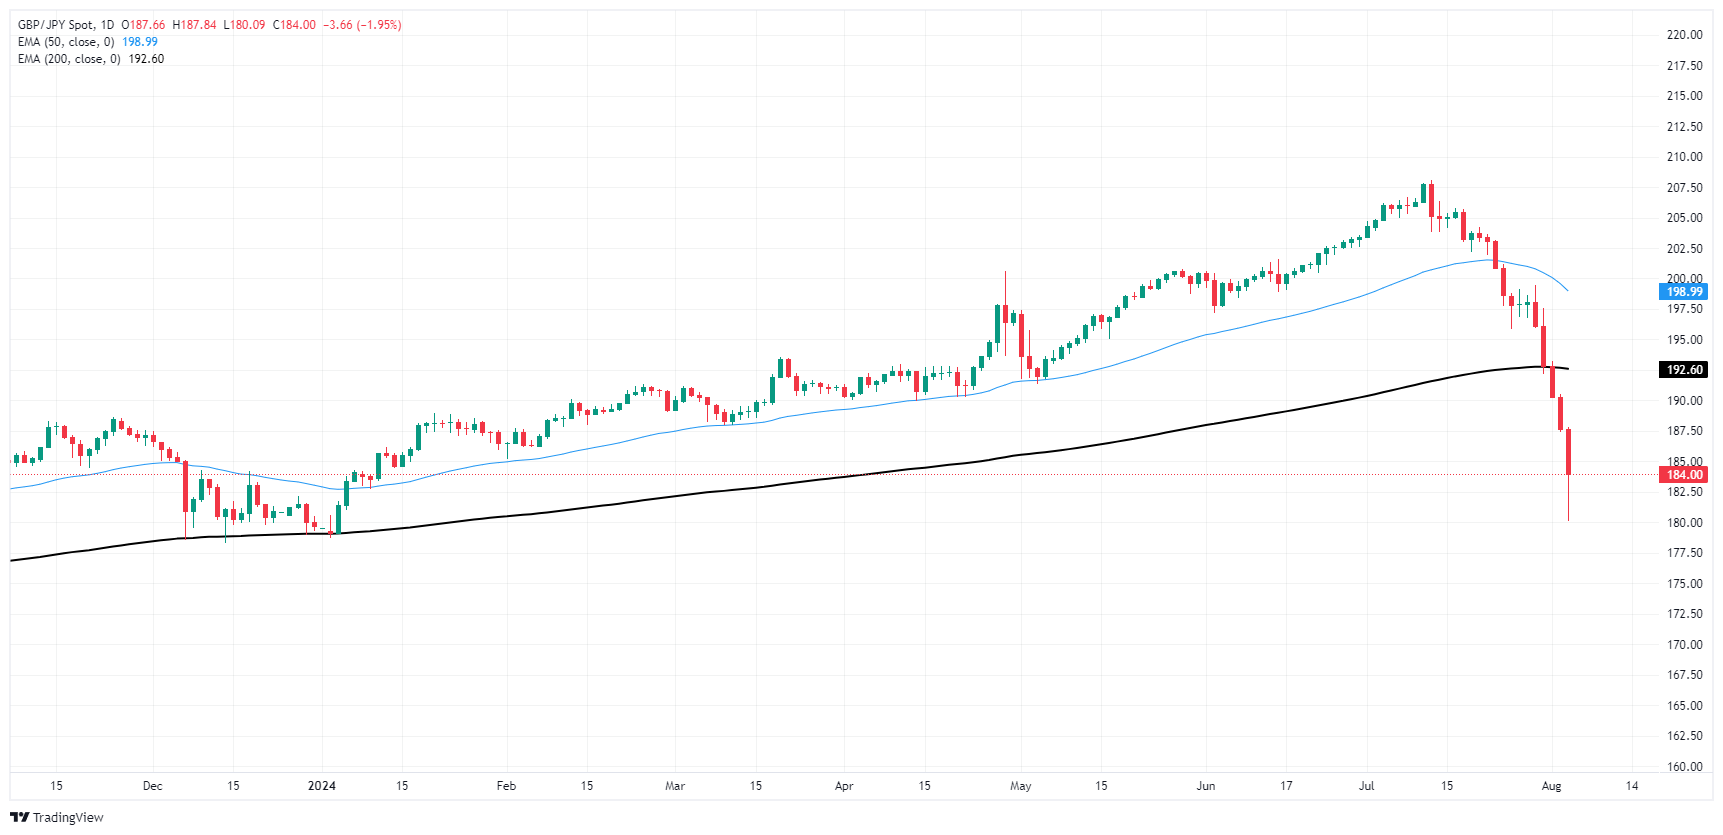
Japanese Yen FAQs
The Japanese Yen (JPY) is one of the world’s most traded currencies. Its value is broadly determined by the performance of the Japanese economy, but more specifically by the Bank of Japan’s policy, the differential between Japanese and US bond yields, or risk sentiment among traders, among other factors.
One of the Bank of Japan’s mandates is currency control, so its moves are key for the Yen. The BoJ has directly intervened in currency markets sometimes, generally to lower the value of the Yen, although it refrains from doing it often due to political concerns of its main trading partners. The current BoJ ultra-loose monetary policy, based on massive stimulus to the economy, has caused the Yen to depreciate against its main currency peers. This process has exacerbated more recently due to an increasing policy divergence between the Bank of Japan and other main central banks, which have opted to increase interest rates sharply to fight decades-high levels of inflation.
The BoJ’s stance of sticking to ultra-loose monetary policy has led to a widening policy divergence with other central banks, particularly with the US Federal Reserve. This supports a widening of the differential between the 10-year US and Japanese bonds, which favors the US Dollar against the Japanese Yen.
The Japanese Yen is often seen as a safe-haven investment. This means that in times of market stress, investors are more likely to put their money in the Japanese currency due to its supposed reliability and stability. Turbulent times are likely to strengthen the Yen’s value against other currencies seen as more risky to invest in.
Empfohlene Artikel


