Altcoins to watch this week: ONDO and SUI bulls aim for double-digit gains

แหล่งที่มา Fxstreet
  • Ondo and Sui prices gain nearly 5% on Monday after a slight decline in the previous week.
  • Both altcoins are approaching their key resistance levels; a breakout would indicate a bullish rally ahead.
  • ONDO and SUI MACD indicators display a bullish crossover, indicating an upward trend. 

Ondo (ONDO) and SUI (SUI) prices gain nearly 5% at the time of writing on Monday, after a slight decline in the previous week. Both altcoins are approaching their key resistance levels; a breakout would indicate a bullish rally ahead. Moreover, their Moving Average Convergence Divergence (MACD) indicator displays a bullish crossover, indicating an upward trend. 

Ondo bulls aiming for the $1.02 mark

Ondo price retested and found support on the previously broken descending trendline (drawn by connecting multiple highs since mid-December) on Wednesday and rose by 4.6% until Saturday. It declined slightly on Sunday. At the time of writing on Monday, ONDO trades higher by nearly 5%, at around $0.87.

If ONDO continues its upward trend and closes above the 50-day Exponential Moving Average (EMA) at $0.89, it could extend the rally by 14% to retest its next resistance level at $1.02, the 200-day EMA. A successful close above this level could extend an additional rally to retest its March 6 high of $1.20.

The Relative Strength Index (RSI) stands at 53, indicating slight bullish momentum, as it is positioned above its neutral level of 50. Moreover, the MACD indicator exhibited a bullish crossover last week, signaling a buying opportunity and an upward trend.
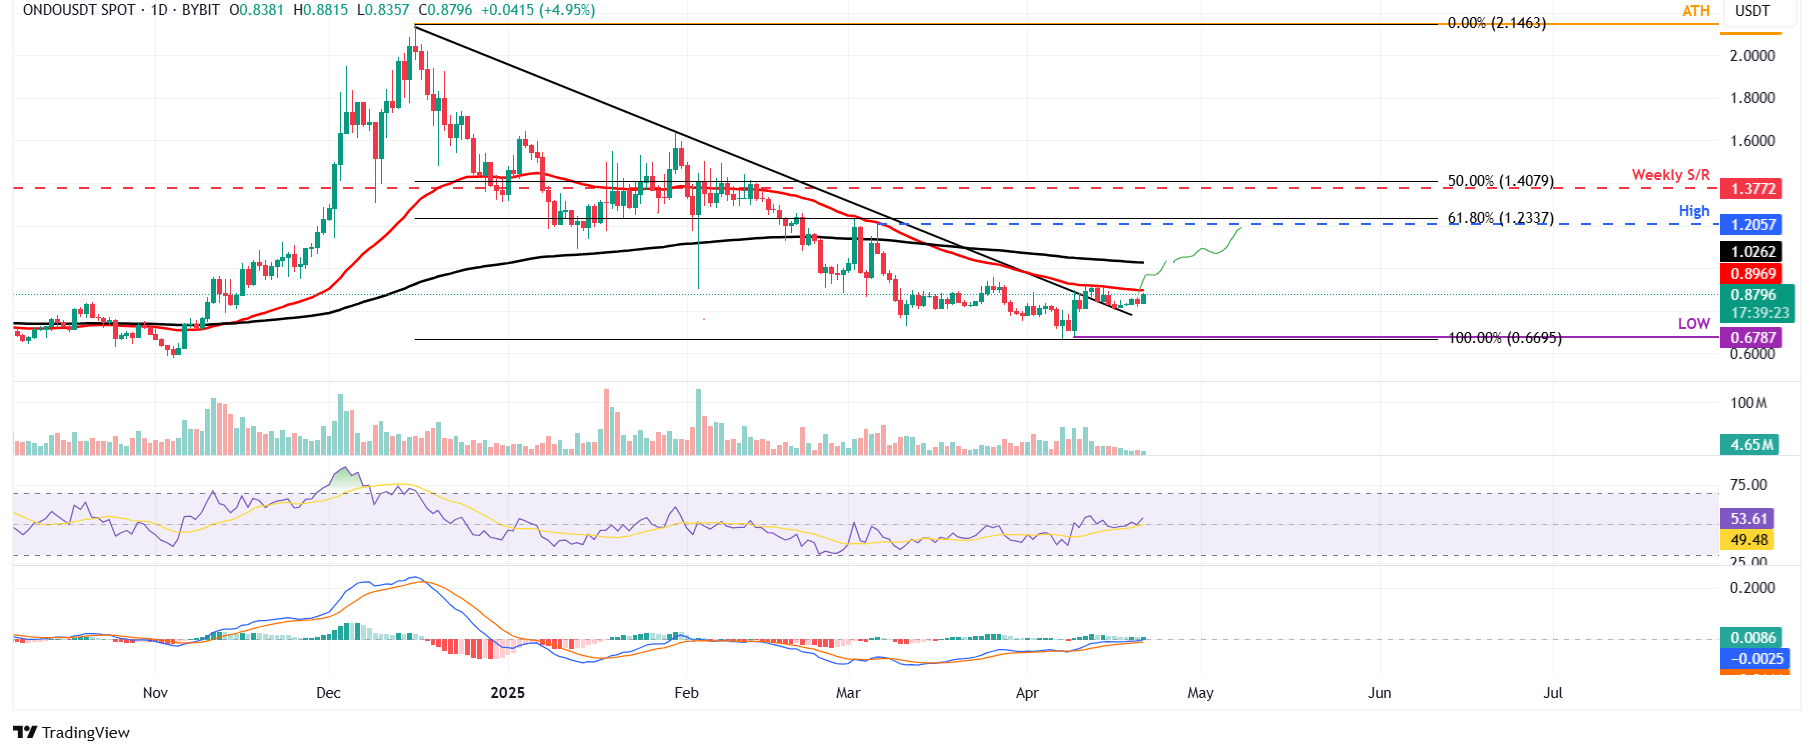
ONDO/USDT daily chart

ONDO/USDT daily chart

However, if ONDO fails to close above its 50-day EMA and decline, it could extend the correction to retest its April 9 low of $0.68.

Sui could rally if it closes above its resistance level at $2.34

Sui price faced rejection around its descending trendline (drawn by connecting multiple highs since early January) on April 13 and declined 10.10% until Sunday. At the time of writing on Monday, SUI trades higher by 5% at $2.22, breaking above this trendline.

If Sui breaks above its descending trendline and closes above its weekly level of $2.34, it could extend the rally by 30% from its current level, potentially retesting its next resistance level at $2.90.

The RSI on the daily chart reads 50 but points upward, indicating fading bearish momentum. The RSI must move above its neutral level of 50 for the bullish momentum to be sustained. The MACD indicator also displayed a bullish crossover last week, signaling a potential buy opportunity and an upward trend.
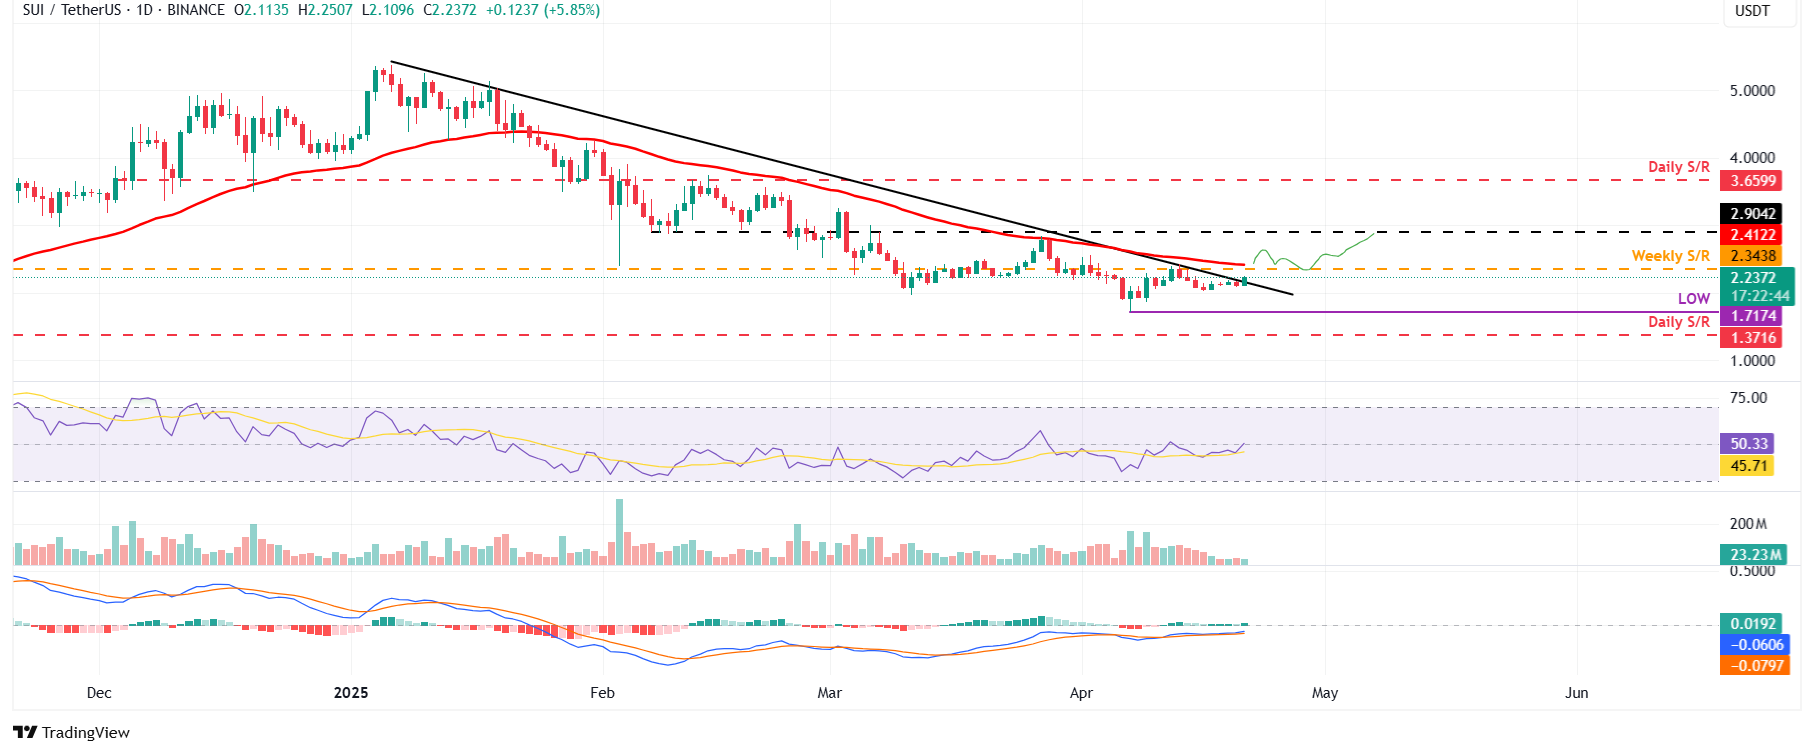
SUI/USDT daily chart

SUI/USDT daily chart

However, if Sui price faces a correction, it could extend the decline to retest its April 7 low of $1.71.

ข้อจำกัดความรับผิดชอบ: เพื่อการอ้างอิงเท่านั้น ผลการดำเนินงานในอดีตไม่ได้บ่งบอกถึงผลลัพธ์ในอนาคต
placeholder
คาดการณ์ราคาเงิน: กระทิง XAGUSD อาจรอการเคลื่อนไหวเหนือระดับ $33.00 ก่อนที่จะวางเดิมพันใหม่โลหะเงิน (XAG/USD) ดึงดูดนักลงทุนที่ซื้อในช่วงราคาต่ำในช่วงเริ่มต้นของสัปดาห์ใหม่และแตะจุดสูงสุดระหว่างวันที่ประมาณโซนราคา $32.80 ในช่วงตลาดลงทุนเอเชีย
ผู้เขียน  FXStreet
11 ชั่วโมงที่แล้ว
โลหะเงิน (XAG/USD) ดึงดูดนักลงทุนที่ซื้อในช่วงราคาต่ำในช่วงเริ่มต้นของสัปดาห์ใหม่และแตะจุดสูงสุดระหว่างวันที่ประมาณโซนราคา $32.80 ในช่วงตลาดลงทุนเอเชีย
placeholder
คาดการณ์ XAUUSD: ราคาทองคำพุ่งใกล้ $3,350 จากความไม่แน่นอนเกี่ยวกับนโยบายภาษีของทรัมป์ราคาทองคํา (XAU/USD) ปรับตัวสูงขึ้นใกล้ $3,350 ในช่วงเช้าของตลาดลงทุนเอเชียวันจันทร์ หลังจากเผชิญกับการปิดออเดอร์เพื่อทำกำไรจากวันหยุดยาว ความไม่แน่นอนเกี่ยวกับนโยบายภาษีของประธานาธิบดีสหรัฐฯ โดนัลด์ ทรัมป์ และความตึงเครียดทางภูมิศาสตร์ที่ยังคงมีอยู่ ยังคงสนับสนุนราคาทองคำ
ผู้เขียน  FXStreet
15 ชั่วโมงที่แล้ว
ราคาทองคํา (XAU/USD) ปรับตัวสูงขึ้นใกล้ $3,350 ในช่วงเช้าของตลาดลงทุนเอเชียวันจันทร์ หลังจากเผชิญกับการปิดออเดอร์เพื่อทำกำไรจากวันหยุดยาว ความไม่แน่นอนเกี่ยวกับนโยบายภาษีของประธานาธิบดีสหรัฐฯ โดนัลด์ ทรัมป์ และความตึงเครียดทางภูมิศาสตร์ที่ยังคงมีอยู่ ยังคงสนับสนุนราคาทองคำ
placeholder
USD/JPY อ่อนค่าลงต่ำกว่า 142.50 เนื่องจาก CPI ของญี่ปุ่นอยู่ที่ 3.6% YoY ในเดือนมีนาคมคู่ USDJPY อ่อนค่าลงใกล้ 142.25 ในช่วงการซื้อขายที่มีวอลลุ่มต่ำในวันศุกร์ ดอลลาร์สหรัฐ (USD) ขยับลงเมื่อเทียบกับเงินเยนของญี่ปุ่น (JPY) ท่ามกลางความกังวลเกี่ยวกับผลกระทบทางเศรษฐกิจจากภาษี
ผู้เขียน  FXStreet
4 เดือน 18 วัน ศุกร์
คู่ USDJPY อ่อนค่าลงใกล้ 142.25 ในช่วงการซื้อขายที่มีวอลลุ่มต่ำในวันศุกร์ ดอลลาร์สหรัฐ (USD) ขยับลงเมื่อเทียบกับเงินเยนของญี่ปุ่น (JPY) ท่ามกลางความกังวลเกี่ยวกับผลกระทบทางเศรษฐกิจจากภาษี
placeholder
ราคาทองคำปรับตัวลงต่ำกว่า 3,300 ดอลลาร์หลังจากทำสถิติสูงสุด ขณะที่พาวเวลล์ชี้ให้เห็นถึงความเสี่ยงของภาวะเศรษฐกิจถดถอยและเงินเฟ้อทองคำปรับตัวลดลงในวันพฤหัสบดี ก่อนวันหยุดอีสเตอร์วันศุกร์ดี โดยลดลง 0.60% หลังจากที่เคยปรับตัวขึ้นเกือบ $400 ในช่วงเจ็ดวันที่ผ่านมา เนื่องจากความไม่แน่นอนเกี่ยวกับนโยบายการค้าของสหรัฐฯ (US) /USD ซื้อขายที่ $3,319 หลังจากทำสถิติสูงสุดที่ $3,357 ในช่วงต้นสัปดาห์
ผู้เขียน  FXStreet
4 เดือน 18 วัน ศุกร์
ทองคำปรับตัวลดลงในวันพฤหัสบดี ก่อนวันหยุดอีสเตอร์วันศุกร์ดี โดยลดลง 0.60% หลังจากที่เคยปรับตัวขึ้นเกือบ $400 ในช่วงเจ็ดวันที่ผ่านมา เนื่องจากความไม่แน่นอนเกี่ยวกับนโยบายการค้าของสหรัฐฯ (US) /USD ซื้อขายที่ $3,319 หลังจากทำสถิติสูงสุดที่ $3,357 ในช่วงต้นสัปดาห์
placeholder
EUR/JPY ซื้อขายด้วยแนวโน้มเชิงบวกเหนือระดับ 162.00; ขาดการสนับสนุนก่อนการประชุม ECBในช่วงเช้าของตลาดลงทุนเอเชียวันพฤหัสบดี คู่ EURJPY ดึงดูดผู้ซื้อเป็นวันที่สองติดต่อกันและปรับตัวขึ้นกลับมายืนเหนือระดับ 162.00
ผู้เขียน  FXStreet
4 เดือน 17 วัน พฤหัส
ในช่วงเช้าของตลาดลงทุนเอเชียวันพฤหัสบดี คู่ EURJPY ดึงดูดผู้ซื้อเป็นวันที่สองติดต่อกันและปรับตัวขึ้นกลับมายืนเหนือระดับ 162.00
goTop
quote