
XRP Price Prediction: XRP battles tariff turbulence amid MVRV buy signal
- XRP rebounds after immense volatility in recent days, triggered by US President Donald Trump’s reciprocal tariffs.
- A negative MVRV ratio signals that XRP is significantly undervalued, calling on traders to buy the token.
- A noticeable decline in the network’s on-chain activities could slow recovery.
Ripple (XRP) seeks stability in a volatile crypto landscape influenced by macroeconomic factors, including reciprocal tariffs. The international money transfer token hit a low of $1.64 on Monday after opening the week at $1.92, representing a 14.5% daily drop. At the time of writing on Tuesday, during the late Asian session, XRP had recovered Monday losses, exchanging hands at $1.92, as global markets continue to adjust and digest United States (US) President Donald Trump’s ever-changing tariff policy.
XRP rebound targets $2 as President Trump maintains tariff tune
After a gruesome sell-off on Monday, major assets like Bitcoin (BTC), Ethereum (ETH), and Solana (SOL) are bouncing back. Trump’s blanket 10% reciprocal tariffs announced on April 2 will be effective on Wednesday.
Despite the bleeding in global markets, including US stocks, Trump insisted during a press conference with Israeli Prime Minister Benjamin Netanyahu on Monday that tariffs would continue as planned. The president seemed to add fuel to the fire, threatening an additional 50% tariff on China.
It is not immediately clear whether the recovery in XRP price to $1.92 is sustainable, especially with tariffs taking effect in just a day. Meanwhile, some on-chain fundamentals support the beginning of a larger rebound, calling on investors to consider buying XRP at current levels.
Santiment’s Market Value Realized Value (MVRV) metric holds 9.47% below the mean at 1 in the chart, suggesting that XRP is heavily undervalued. Traders holding the XRP token are unlikely to sell at the current price as they would realize substantial losses. This situation could translate to reduced selling pressure, hinting at a potential rebound amid growing seller exhaustion. A negative MVRV ratio has historically been viewed as a buy signal.
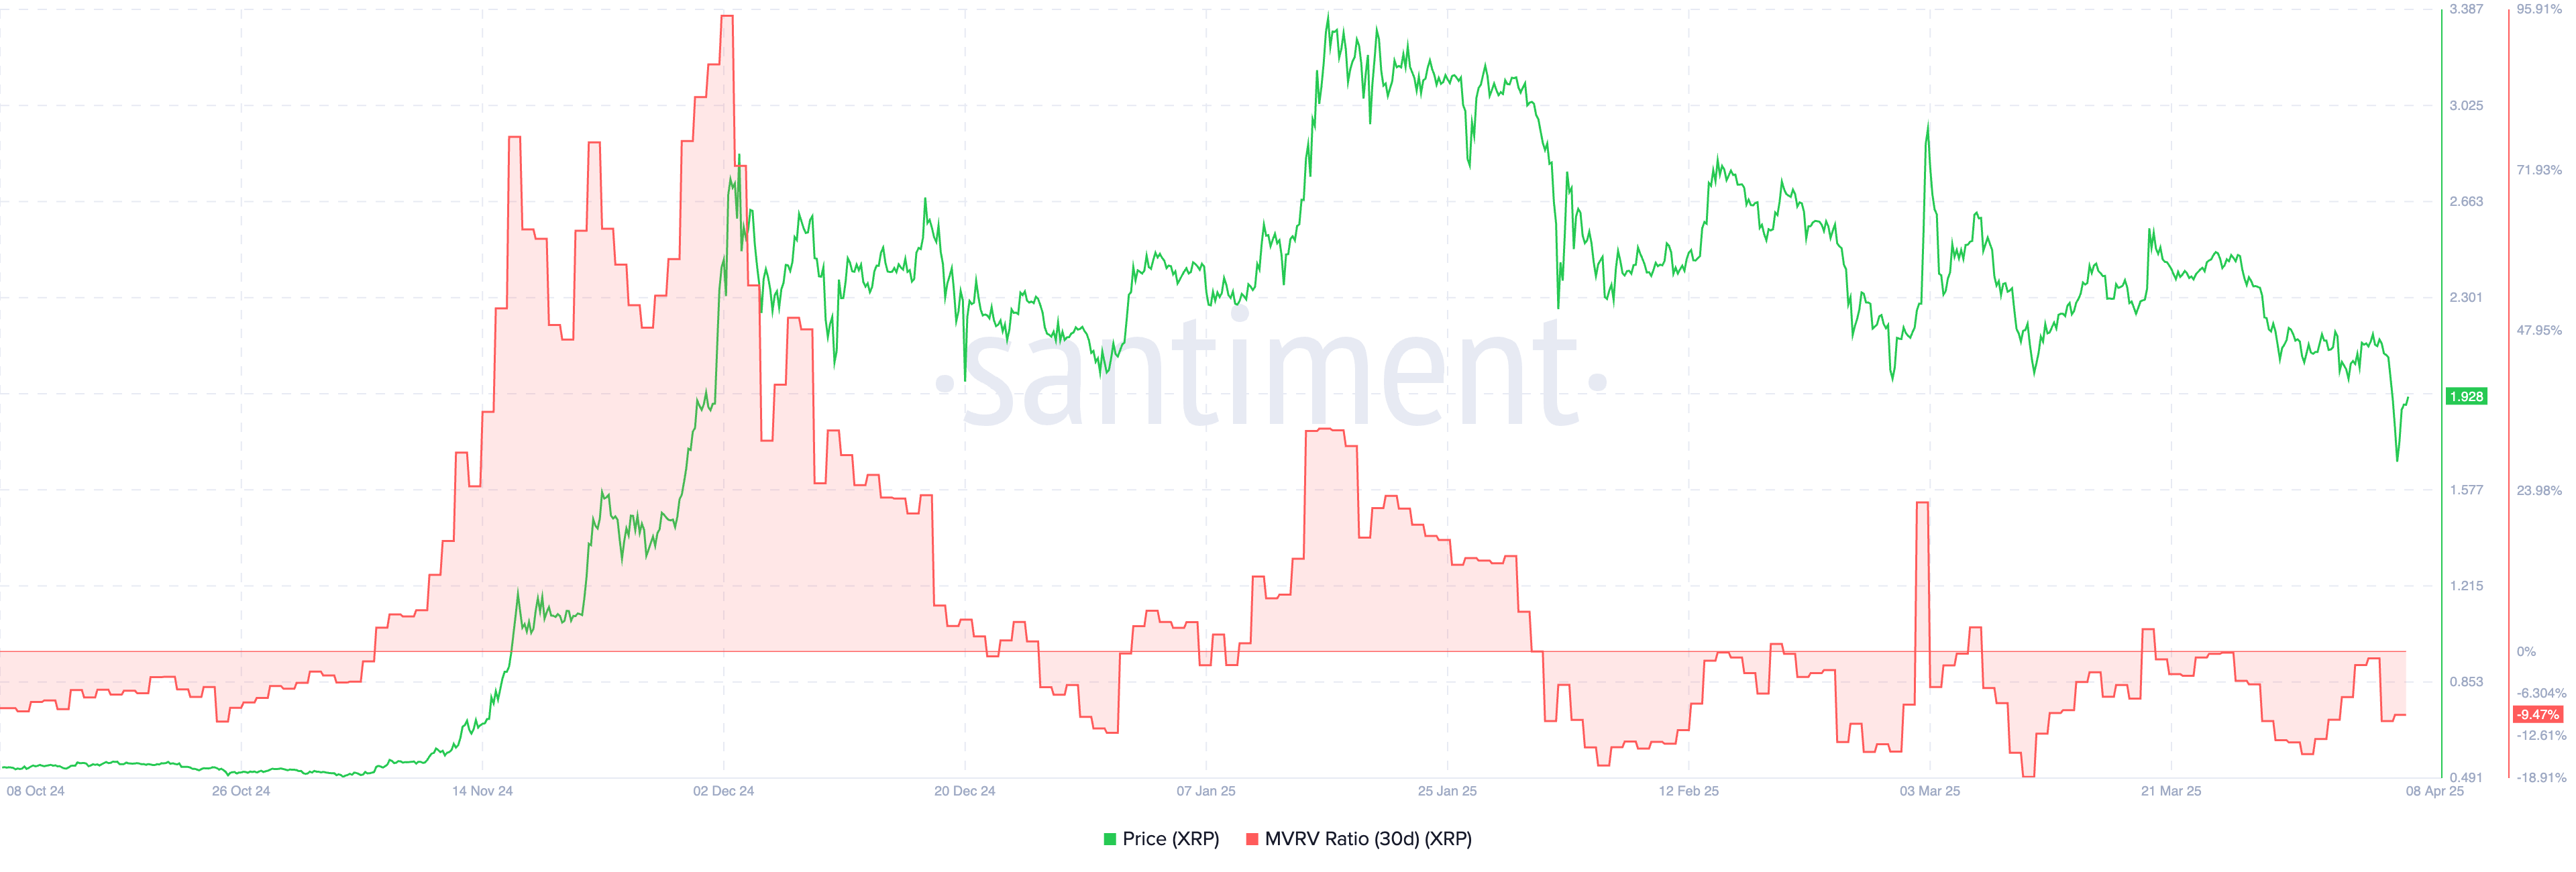
XRP MVRV | Source: Santiment
Can XRP sustain a recovery above $2?
XRP could rejuvenate its bullish structure if support at $2 is reclaimed. However, bulls must first navigate a volatile landscape to keep the price higher, including a daily close above the 200-day Exponential Moving Average (EMA). Moreover, the Relative Strength Index (RSI) continues to slide toward the oversold region, which may encourage sellers to stay put. At the same time, the Moving Average Convergence Divergence (MACD) indicator sustained a sell signal on March 28, suggesting a deeper downtrend is in play.
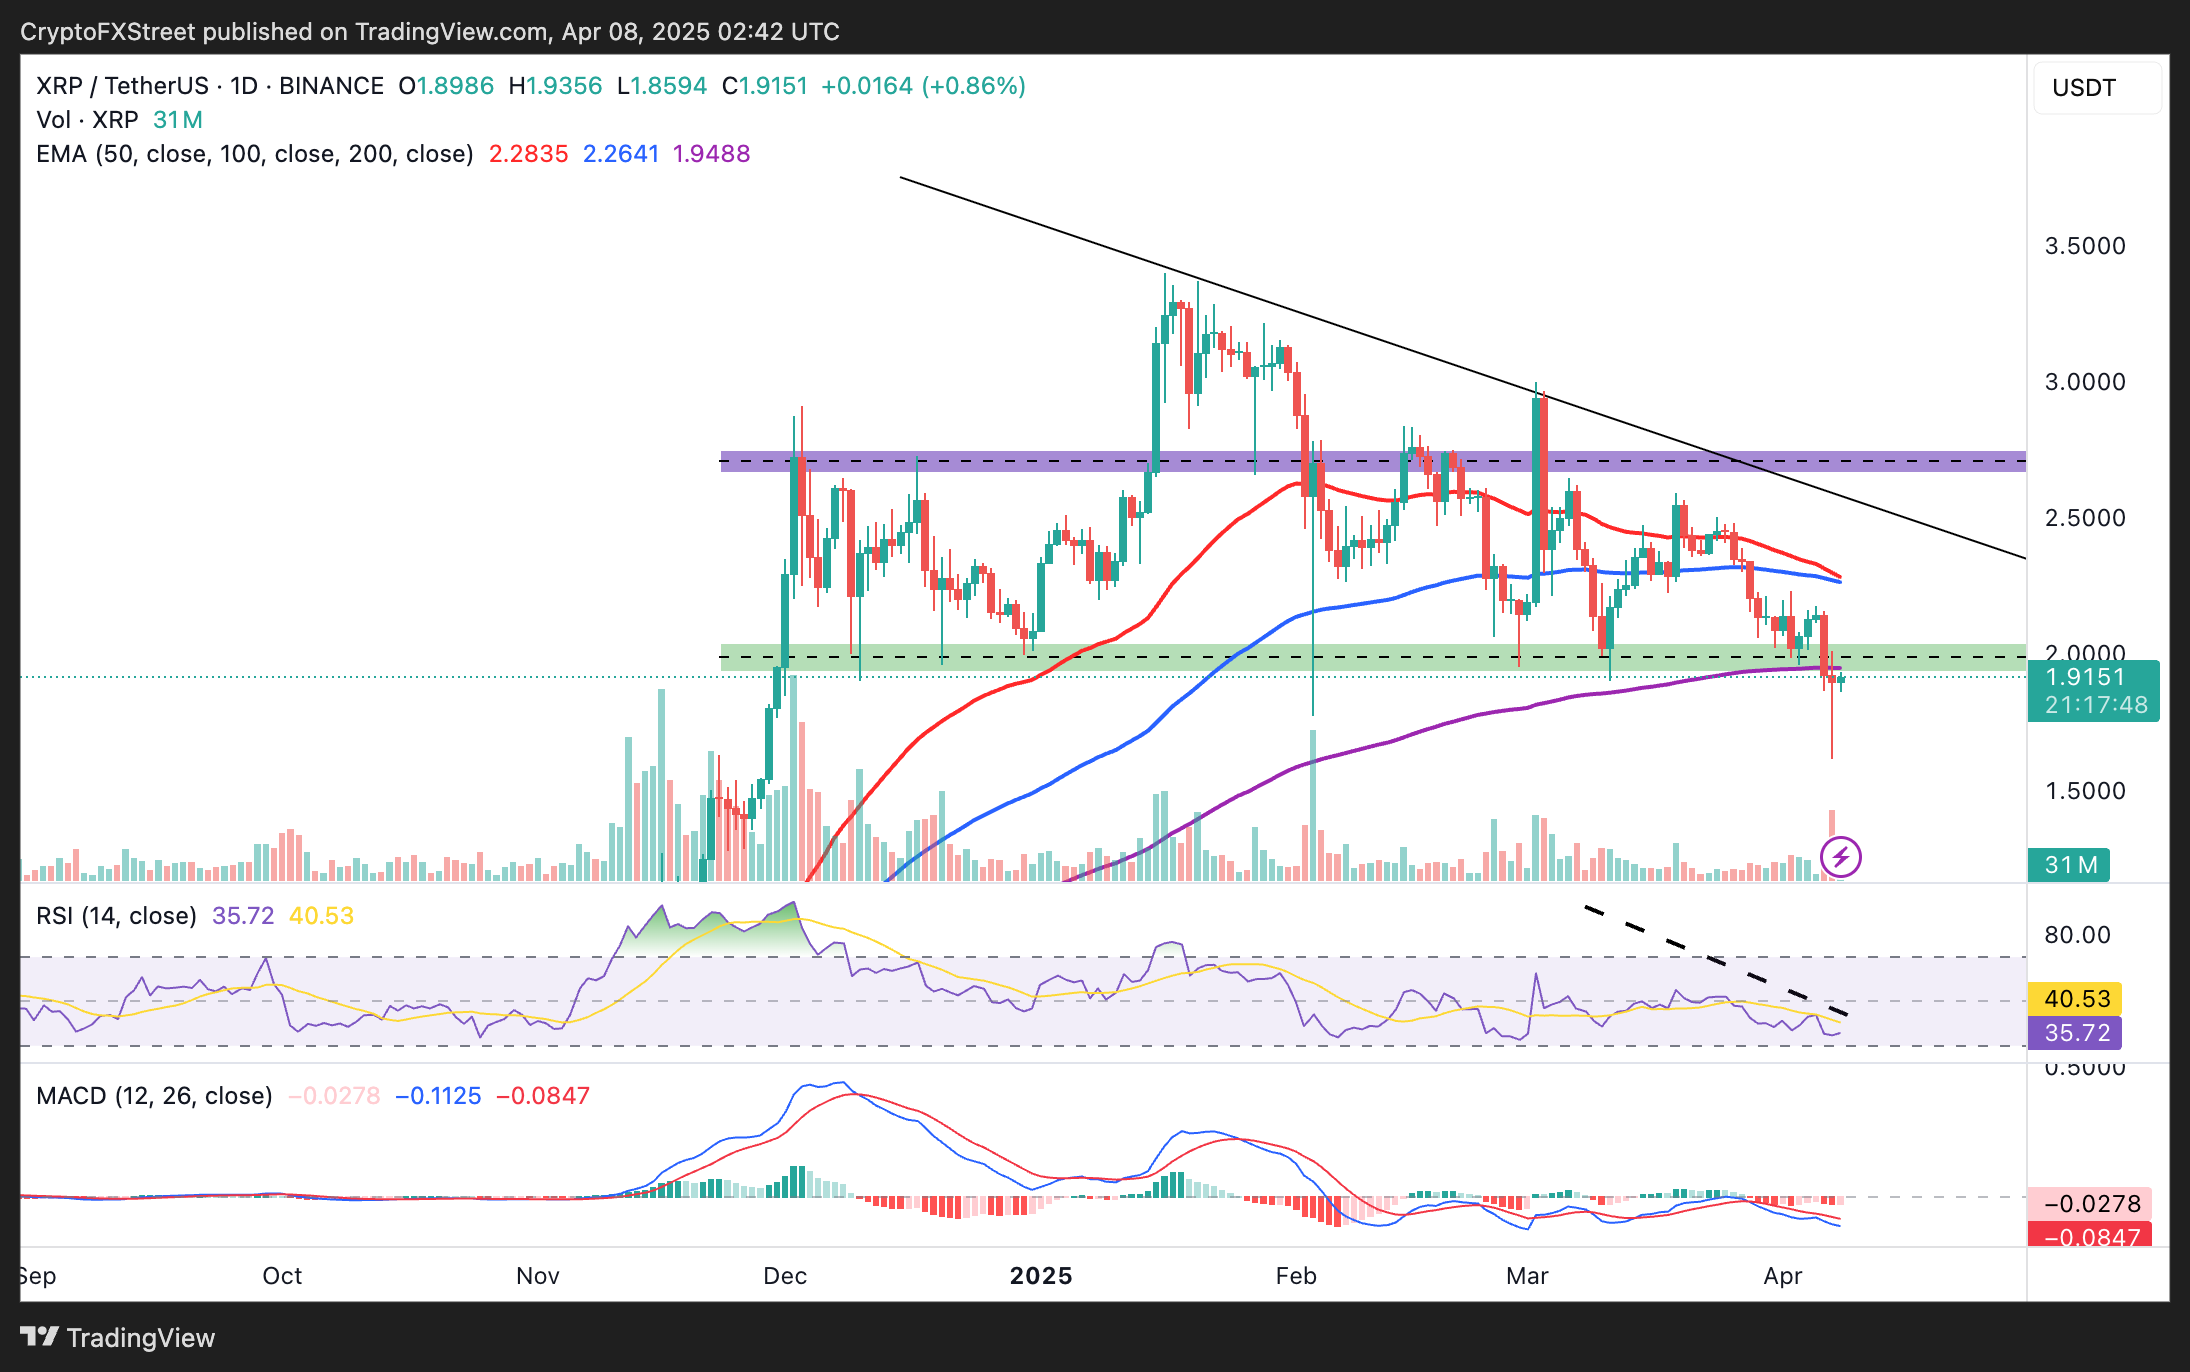
XRP/USDT daily chart
All eyes are set on the bull’s ability to reclaim the $2.00 level as support — a move that could reinforce XRP’s bullish structure and pave the way for recovery to $3.00.
However, the declining network activity observed with Santiment’s Daily Active addresses metric could slow recovery. As per the chart, only 10,100 addresses were active on the network on Monday compared to 581,000 addresses on March 19.
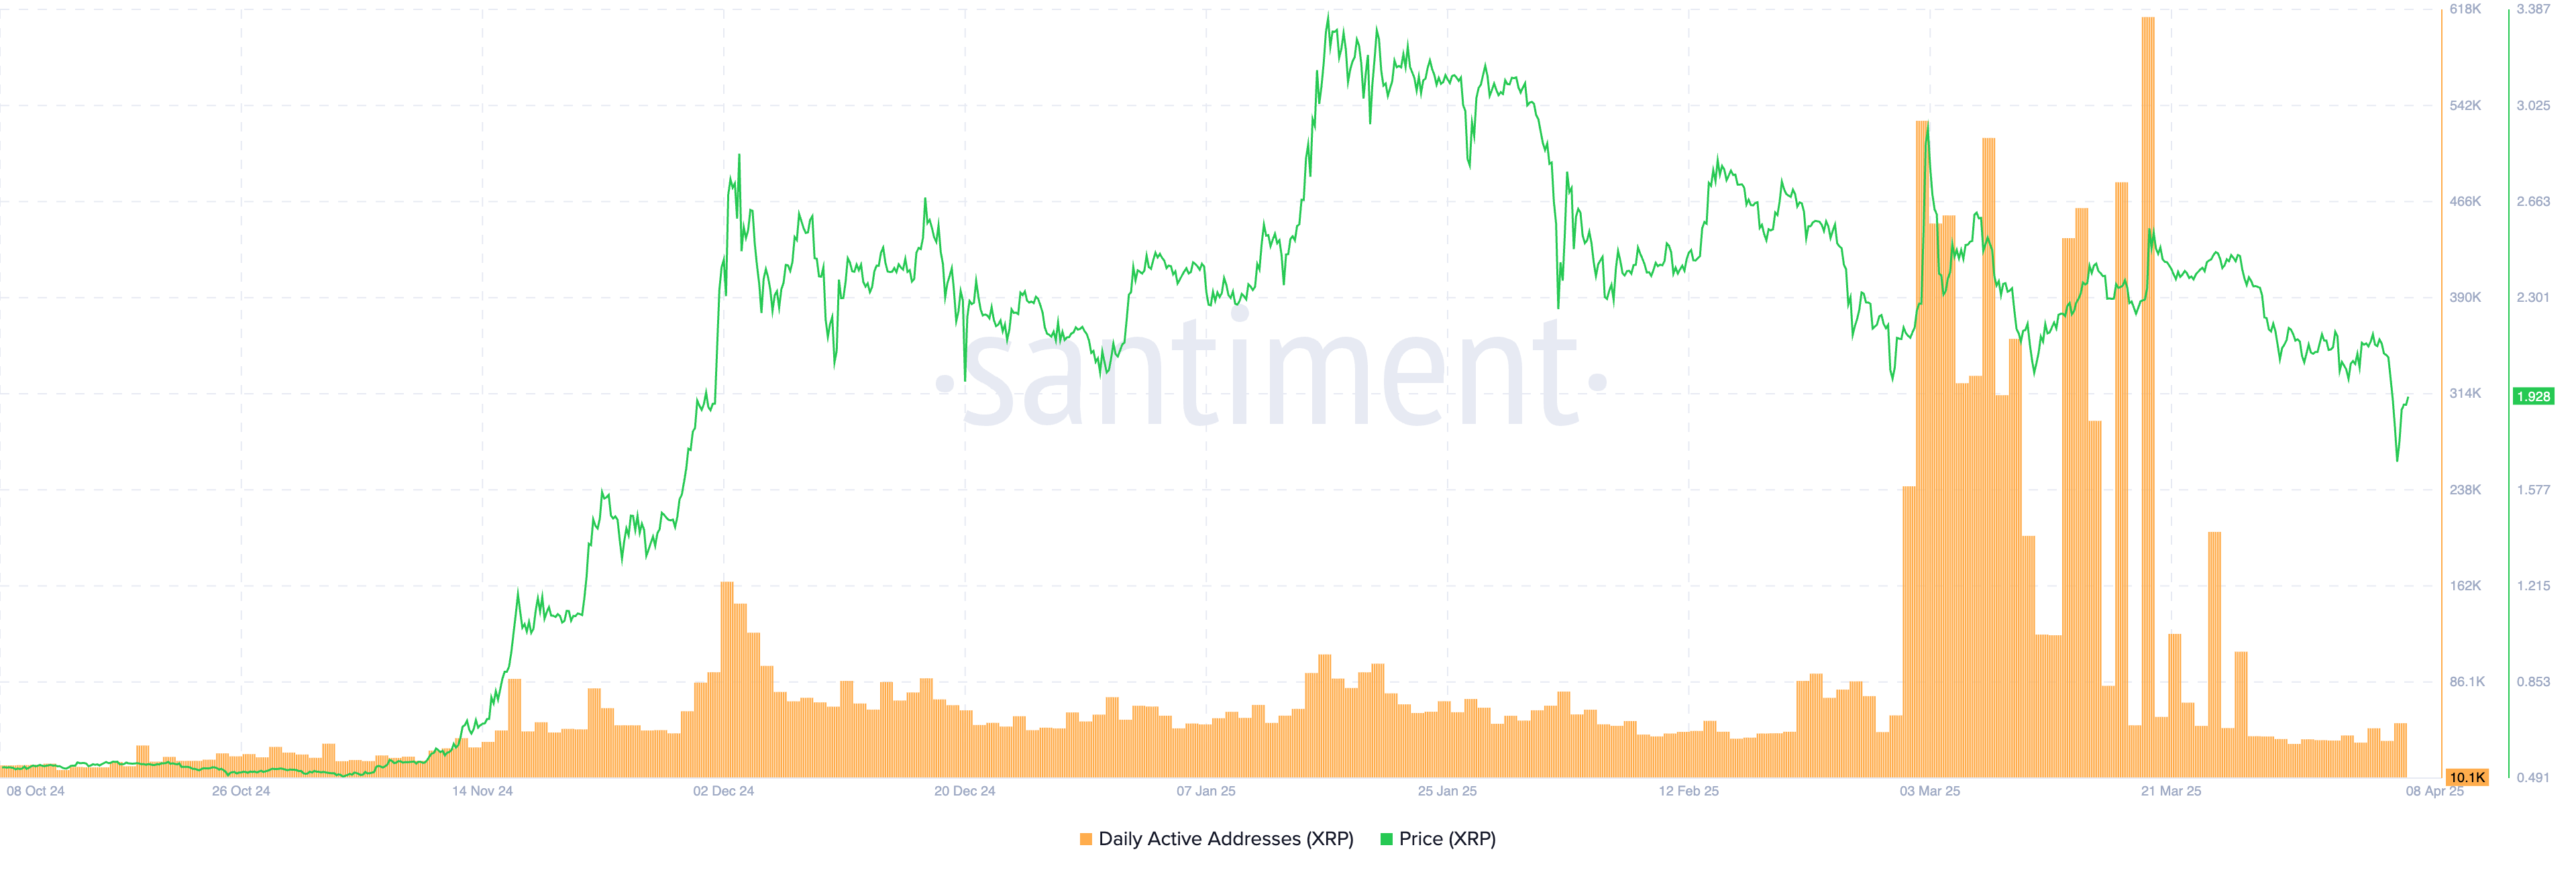
XRP Daily Active Addresses | Source: Santiment
A consistent drop in network activity impacts the underlying asset’s performance, depriving it of momentum to sustain recovery due to low demand. Hence, waiting for a trend confirmation before going all in and buying the dip would be prudent.
บทความแนะนำ


