
Solana Price Forecast: Bears gain momentum as SOL falls below $100
- Solana's price extends its decline on Monday after crashing 15.15% last week.
- Coinglass data shows that SOL’s leveraged traders wiped out nearly $70 million in liquidations in the last 24 hours.
- The technical outlook suggests further correction as DEX trading volume reaches its lowest yearly level, with SOL targeting the $92.88 mark.
Solana (SOL) extends its loss by over 7% and falls below the $100 mark at the time of writing on Monday after crashing 15.15% last week. Coinglass data shows that SOL’s leveraged traders wiped out nearly $70 million in liquidations in the last 24 hours. The technical outlook suggests further correction as the Decentralized Exchange (DEX) trading volume reaches its lowest yearly level, with SOL targeting the February 2024 low of $92.88.
Solana traders face massive wipeout
The crypto market experienced a sharp decline during the early Asain trading session on Monday, which traders are starting to call ‘Black Monday’. Bitcoin fell below $75,000 and reached a new yearly low of $74,701, leading to a massive liquidation of over $1 billion in the last 24 hours.
Solana's price follows BTC’s footsteps and crashes below $100, trading around $97.50 and losing over 7% at the time of writing after crashing 15.15% last week. This sharp fall from Monday’s open triggered a wave of liquidations, resulting in nearly $70 million in liquidations in SOL in the last 24 hours, according to data from CoinGlass.
Huge liquidations like this could spark Fear, Uncertainty and Doubt (FUD) among SOL investors and cause a rise in selling pressure, leading to further price declines.
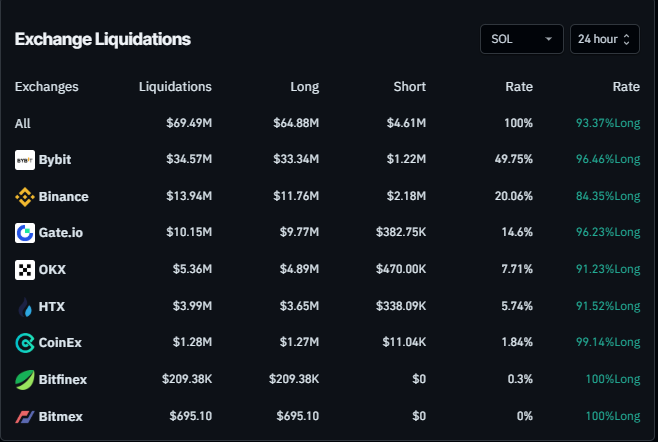
SOL liquidation chart. Source: Coinglass
One reason for this crash in Solana and cryptocurrencies is that US President Donald Trump announced tariffs last week on Wednesday, as explained in this report.
This announcement has sparked a global trade war, with China retaliating by imposing a 34% levy on US goods, which has caused a fall not only in the crypto market but also in Asian markets, with Japan’s stock market reaching its lowest level since October 2023 on Monday.
Another bearish outlook for Solana is a recent fall in traders’ interest and liquidity in the SOL chain. According to Arthemis, data shows that SOL Chain's DEX trading volume has constantly fallen since mid-January of $35.60 billion and reached the lowest yearly level of $713.6 million on Saturday.
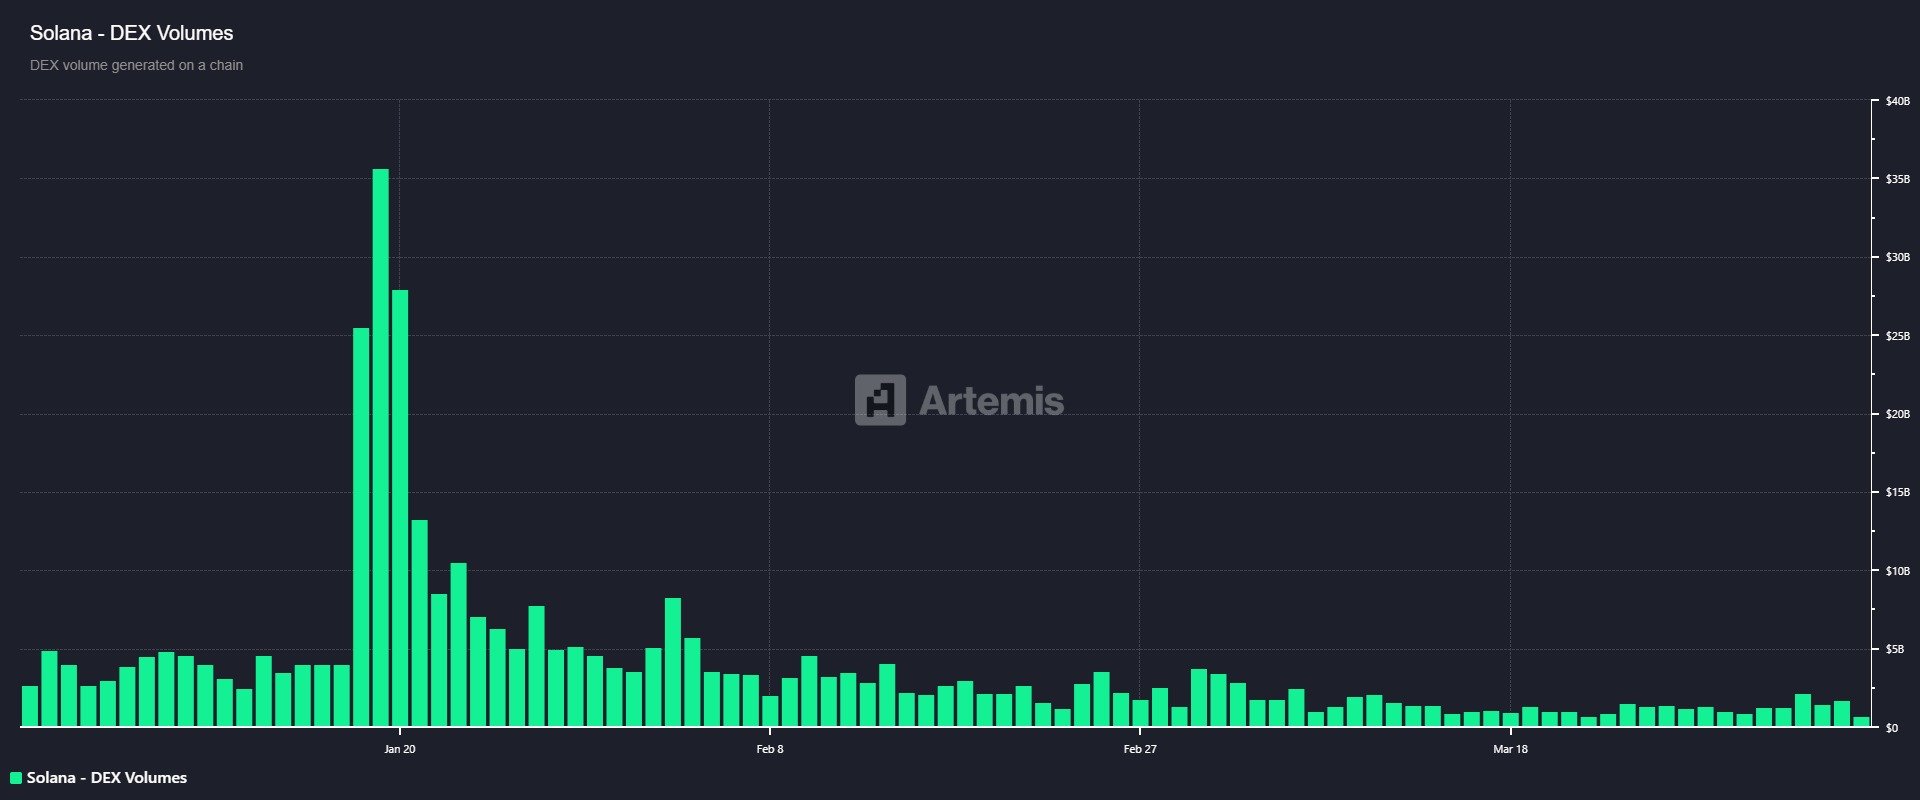
Solana DEX-volume chart. Source: Artemis
Solana Price Forecast: SOL bears take the lead, targeting $92.88
Solana price closed below its daily support of $118.10 on Sunday and declined almost 12% that day. At the time of writing on Monday, SOL extends its decline by over 7%, trading below $100.
If SOL continues to crash, it could extend the decline to retest its February 6, 2024, low of $92.88.
The Relative Strength Index (RSI) on the daily chart reads 29, indicating that SOL is oversold and could be due for a price recovery to the upside. However, the RSI could remain below the oversold level of 30 and continue its downward spiral. Moreover, the Moving Average Convergence Divergence (MACD) indicator showed a bearish crossover last week, giving a sell signal and suggesting a downward trend.
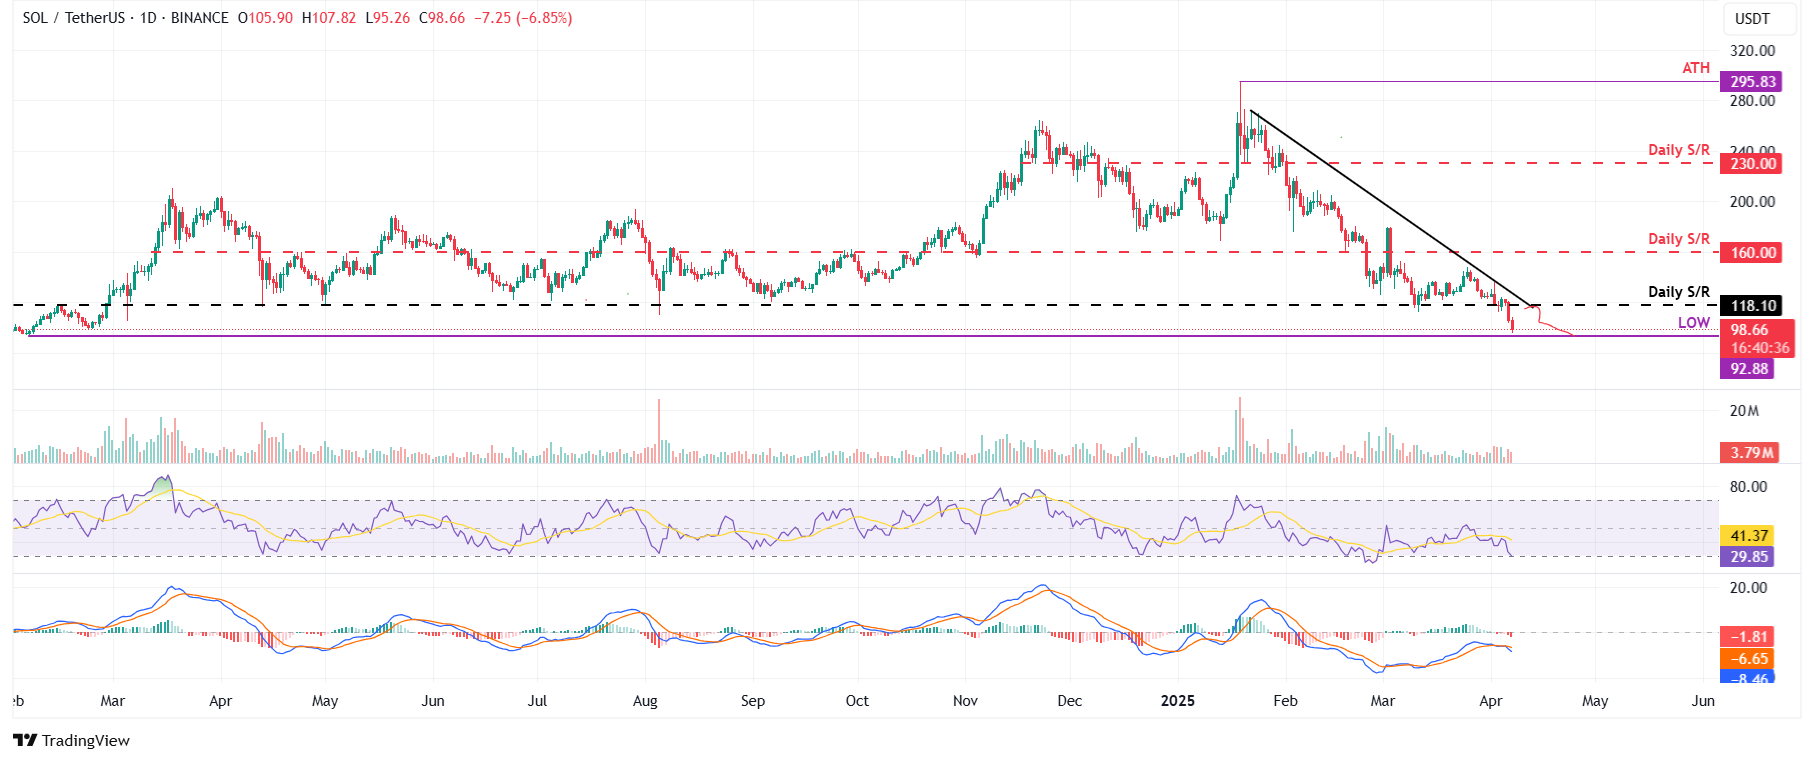
SOL/USDT daily chart
If SOL recovers, it could extend the recovery to retest its important psychological level at $100.
บทความแนะนำ


