
Dogecoin lead double-digit gains across meme coins, with Shiba Inu, PEPE and BONK skyrocketing to new monthly highs
- Dogecoin is up over 13% on Wednesday, surging above a key descending trendline resistance.
- PEPE and SHIB flipped their respective 50-day SMAs and key resistance levels.
- BONK surged more than 20% and is testing a major resistance near $0.00001579.
- The daily Stochastic Oscillators across these meme coins indicate corrections could be seen in the near term.
Top meme coins Dogecoin (DOGE), Shiba Inu (SHIB), PEPE and BONK lead the meme coin sector with double-digit gains on Wednesday following the crypto market recovery. After smashing key resistance levels near their respective 50-day Simple Moving Averages (SMA), these meme coins now face a key hurdle close to the 100-day SMA.
DOGE rallies 13%, bulls set sights on $0.1809 resistance
After rising more than 13% in the past 24 hours, Dogecoin sparked $11.68 million in futures liquidations with short positions dominating over 85% of the losses, according to Coinglass data.
This comes after DOGE rallied above a key descending trendline resistance and the 50-day SMA on Tuesday. The top meme coin is tackling the next resistance level at $0.1809.
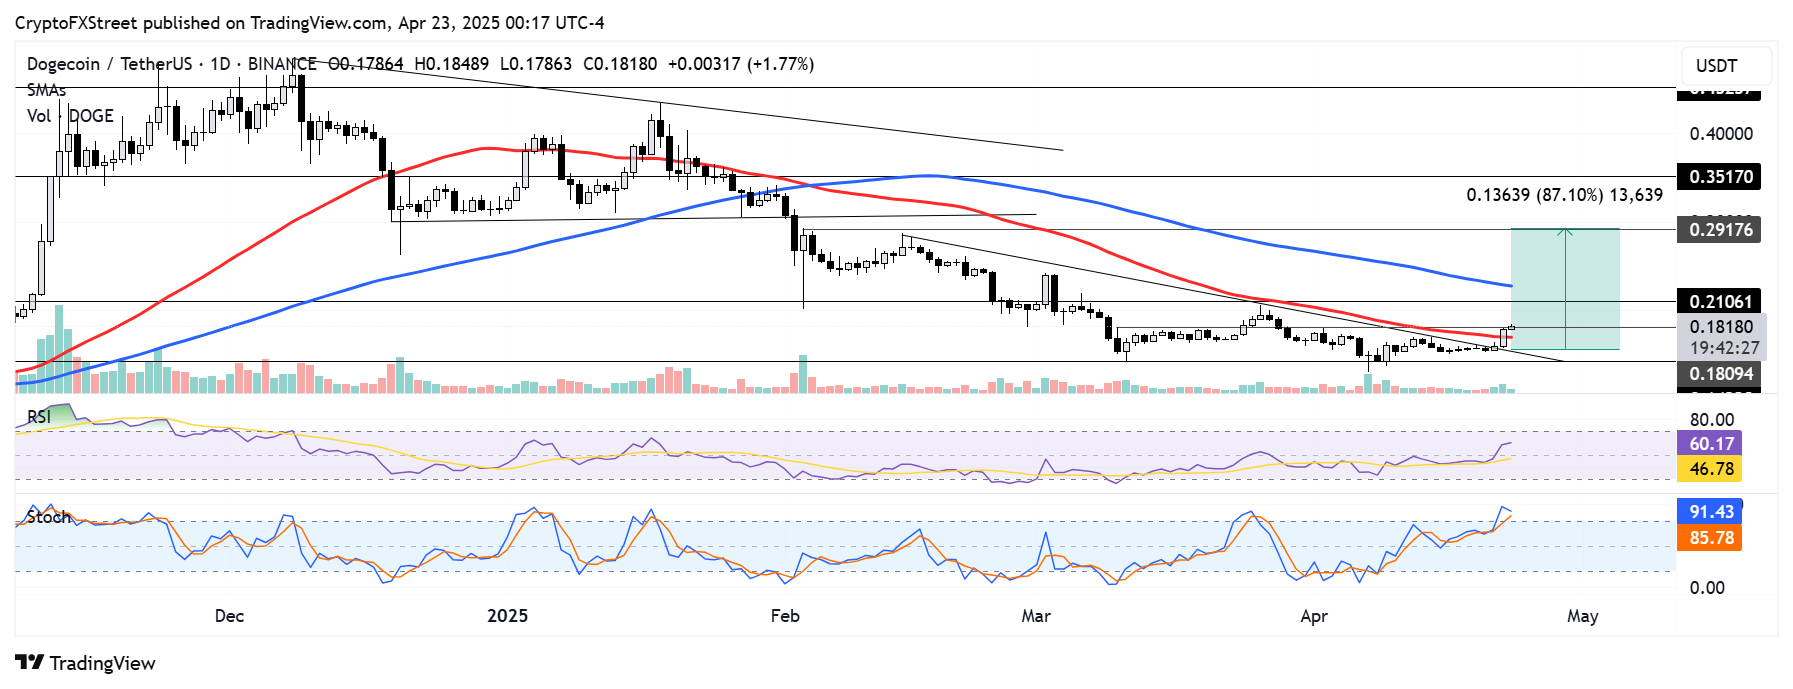
DOGE/USDT daily chart
If DOGE moves above $0.1809, it could stretch its rally over 80% within the next couple of weeks. However, it has to overcome hurdles at $0.2106 and the 100-day SMA to complete such a move.
On the downside, a rejection at $0.1809 could see DOGE finding support near the descending trendline and 50-day SMA. A decline below these levels could signal a return toward consolidation.
It's important to note that DOGE's current trading volume is quite low compared to previous months, signaling the rising bullish momentum is still weak.
The Relative Strength Index (RSI) is above its neutral level, and the Stochastic Oscillator (Stoch) is in the overbought region, indicating a potential short-term correction could be on the horizon.
PEPE and SHIB smash 50-day SMAs but face 100-day SMA resistances
PEPE is up over 14% in the past 24 hours, surging above its 50-day SMA and the resistance level near $0.00000762. However, the frog-themed meme coin is facing resistance near the 100-day SMA.
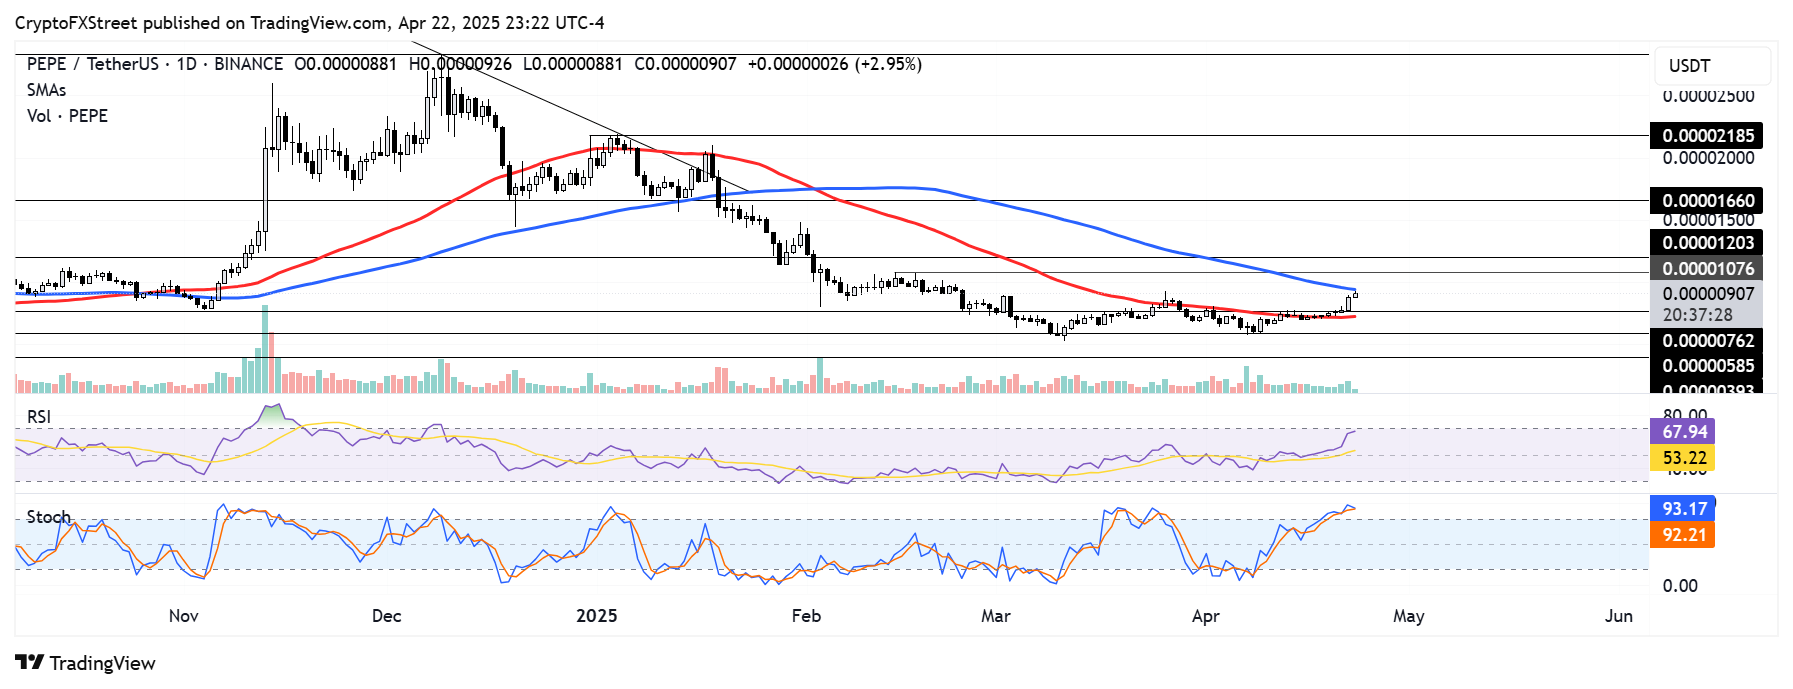
PEPE/USDT daily chart
A failure to overcome the 100-day SMA could send PEPE to test the $0.00000762 level as a support. On the contrary, a move above the 100-day SMA could send PEPE toward $0.00001076.
The RSI and Stoch are near and in the overbought regions, respectively, indicating a potential short-term correction.
Similar to PEPE, Shiba Inu rallied above a key descending trendline and the 50-day SMA in the past 24 hours. If it holds these levels as support, it could continue its charge to tackle the $0.00001612 resistance. However, it could face selling pressure at the 100-day SMA. The RSI is above its neutral level, while the Stoch is in the overbought region.
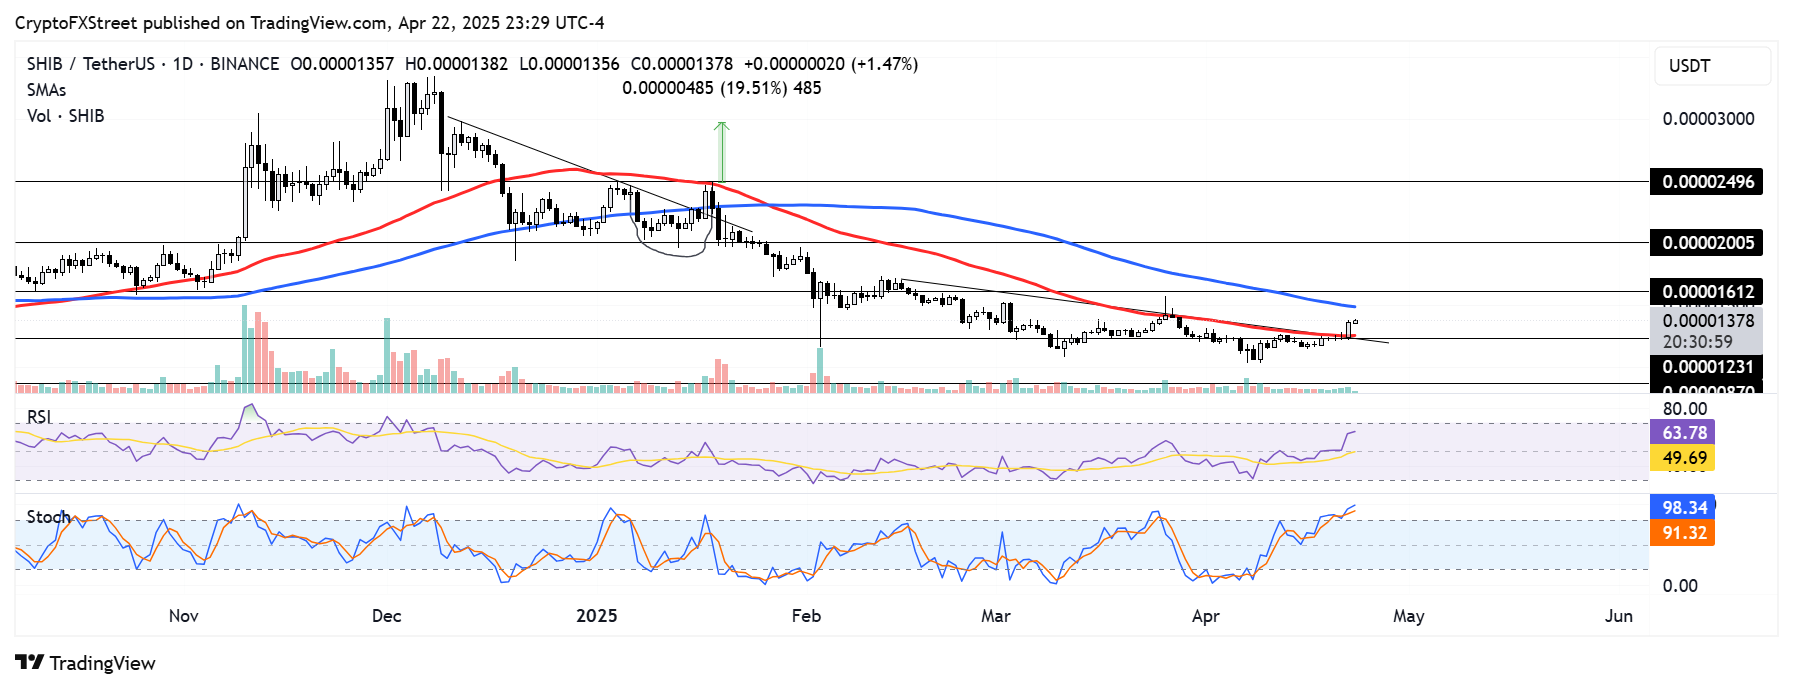
SHIB/USDT daily chart
BONK soars over 20%, tests $0.00001579 key hurdle
BONK bounced 25% from Monday's low of $0.00001226 after holding the 50-day SMA support for more than eleven days — amid heightened bearish pressure across meme coins in the past week.
BONK is now testing a major resistance level at $0.00001579 — which is strengthened by the 100-day SMA. A cross above the resistance could see BONK stretching its gains by 55% in the coming days. However, a rejection could send the Solana meme coin back toward its 50-day SMA support.
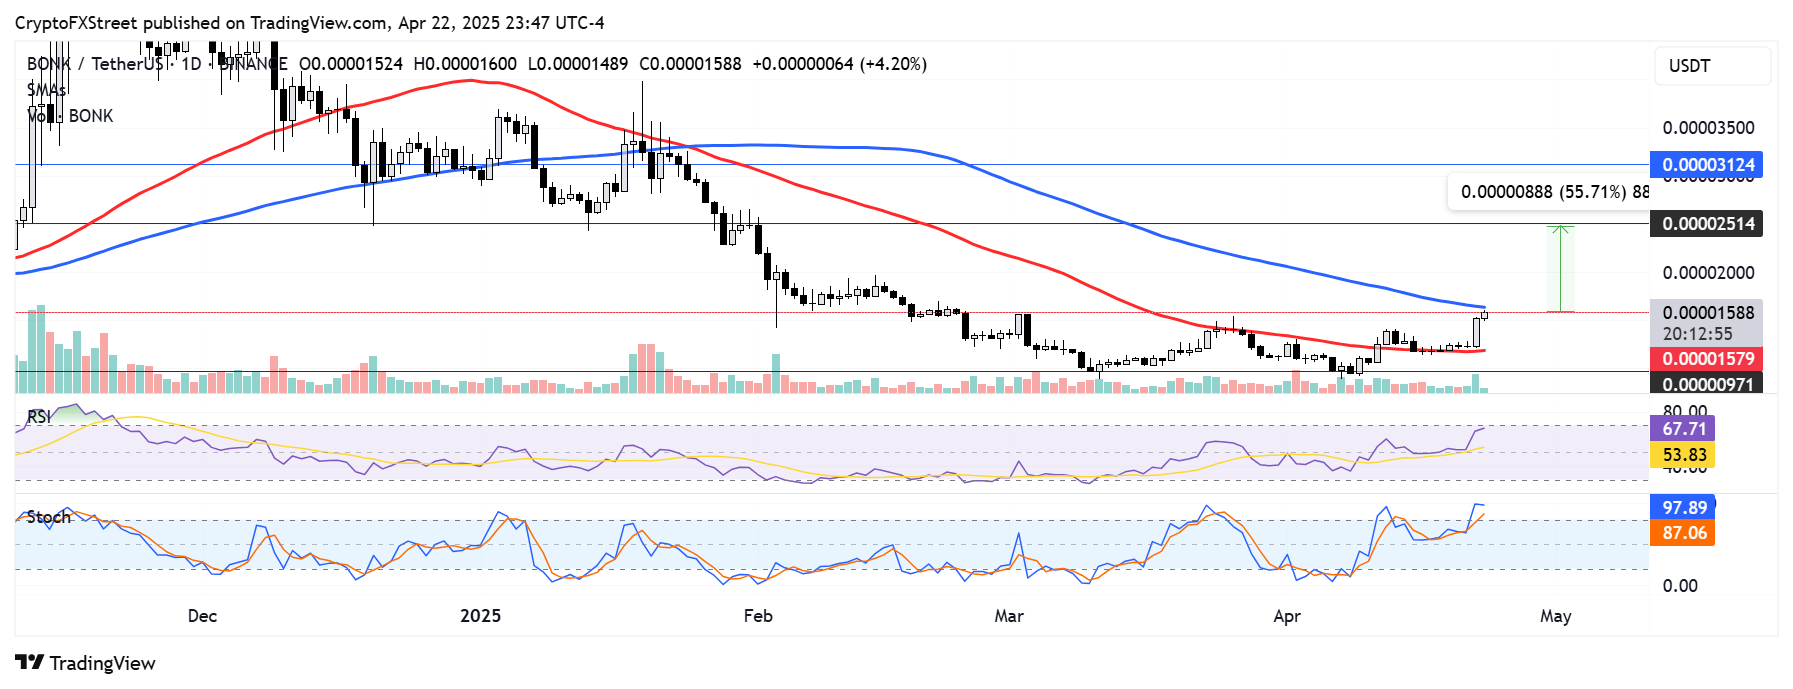
BONK/USDT daily chart
Like its meme coin counterparts, BONK's daily RSI and Stoch are near and in the overbought regions, respectively.
While price movements around key technical levels across the daily charts of these meme coins could trigger a major downtrend or uptrend, their prices are still heavily correlated with Bitcoin. Hence, it's worth monitoring the performance of the top crypto alongside the aforementioned meme coins’ technical levels.
บทความแนะนำ


