
Top 3 gainers Bittensor, Render, AIOZ Network: Why AI tokens are stealing the spotlight in a slow altcoin season
- An elusive altcoin season forces investors to think outside the box, with AI tokens emerging as the ultimate winners.
- Bittensor, Render, and AIOZ Network break out ahead of the weekend, fuelling optimism for more short-term gains.
- Fears of a recession in the US gain momentum as Fed Chair Jerome Powell warns of the larger-than-expected impact of tariffs.
Artificial Intelligence (AI) tokens are making a speedy return into the spotlight, including Bittensor (TAO), Render (RNDR), and AIOZ Network (AIOZ), as highlighted by their price action in the past 24 hours. TAO leads with a more than 2% daily increase to trade at $254 at the time of writing on Friday, in addition to a 10% growth in the last 24 hours. RNDR and AIOZ are among the AI tokens in the green, hovering at $4.05 and $0.27, respectively.
AI tokens spice up the mundane altcoin season
The bull cycle in the cryptomarket has left many investors and crypto enthusiasts wondering whether there will be an altcoin season. Bitcoin surged tremendously in the fourth quarter of 2024, fuelled by the United States (US) Presidential election. This bullish momentum continued in the early days of this year, buoyed by the anticipation of a strategic Bitcoin Reserve and digital asset stockpile promised by US President Donald Trump.
The largest cryptocurrency by market capitalization topped out at $109,588 on January 20, marking the local top and the beginning of what would turn out to be a slow bull cycle, at least for most of the altcoins.
Investors have been forced to endure extended drawdowns in altcoin prices caused by low liquidity levels and a change in market leadership from retail to institutional investors, thanks to the approval of spot Bitcoin Exchange Traded Funds (ETFs).
The market is generally cautious, with tempered expectations as opposed to euphoric rallies seen in other bull cycles. As FXStreet reported on Thursday, there has been a noticeable shift from major altcoins to Bitcoin and meme coins. However, with market dynamics and depth changing rapidly, a more complex market structure will likely develop in the medium to long term.
Bittensor is on the verge of a 50% breakout
Bittensor, a decentralized and open-source protocol that leverages blockchain for a machine learning network while allowing AI models to train collaboratively, is edging closer to a falling wedge pattern breakout. The daily chart below shows that TAO is testing resistance at the upper trendline, coinciding with the 50-day Exponential Moving Average (EMA) at $264
If the breakout is validated and accompanied by a spike in trading volume, Bittensor may ascend 50% to approximately $393. This target is arrived at by measuring the distance between the pattern’s widest points, extrapolated above the breakout point.
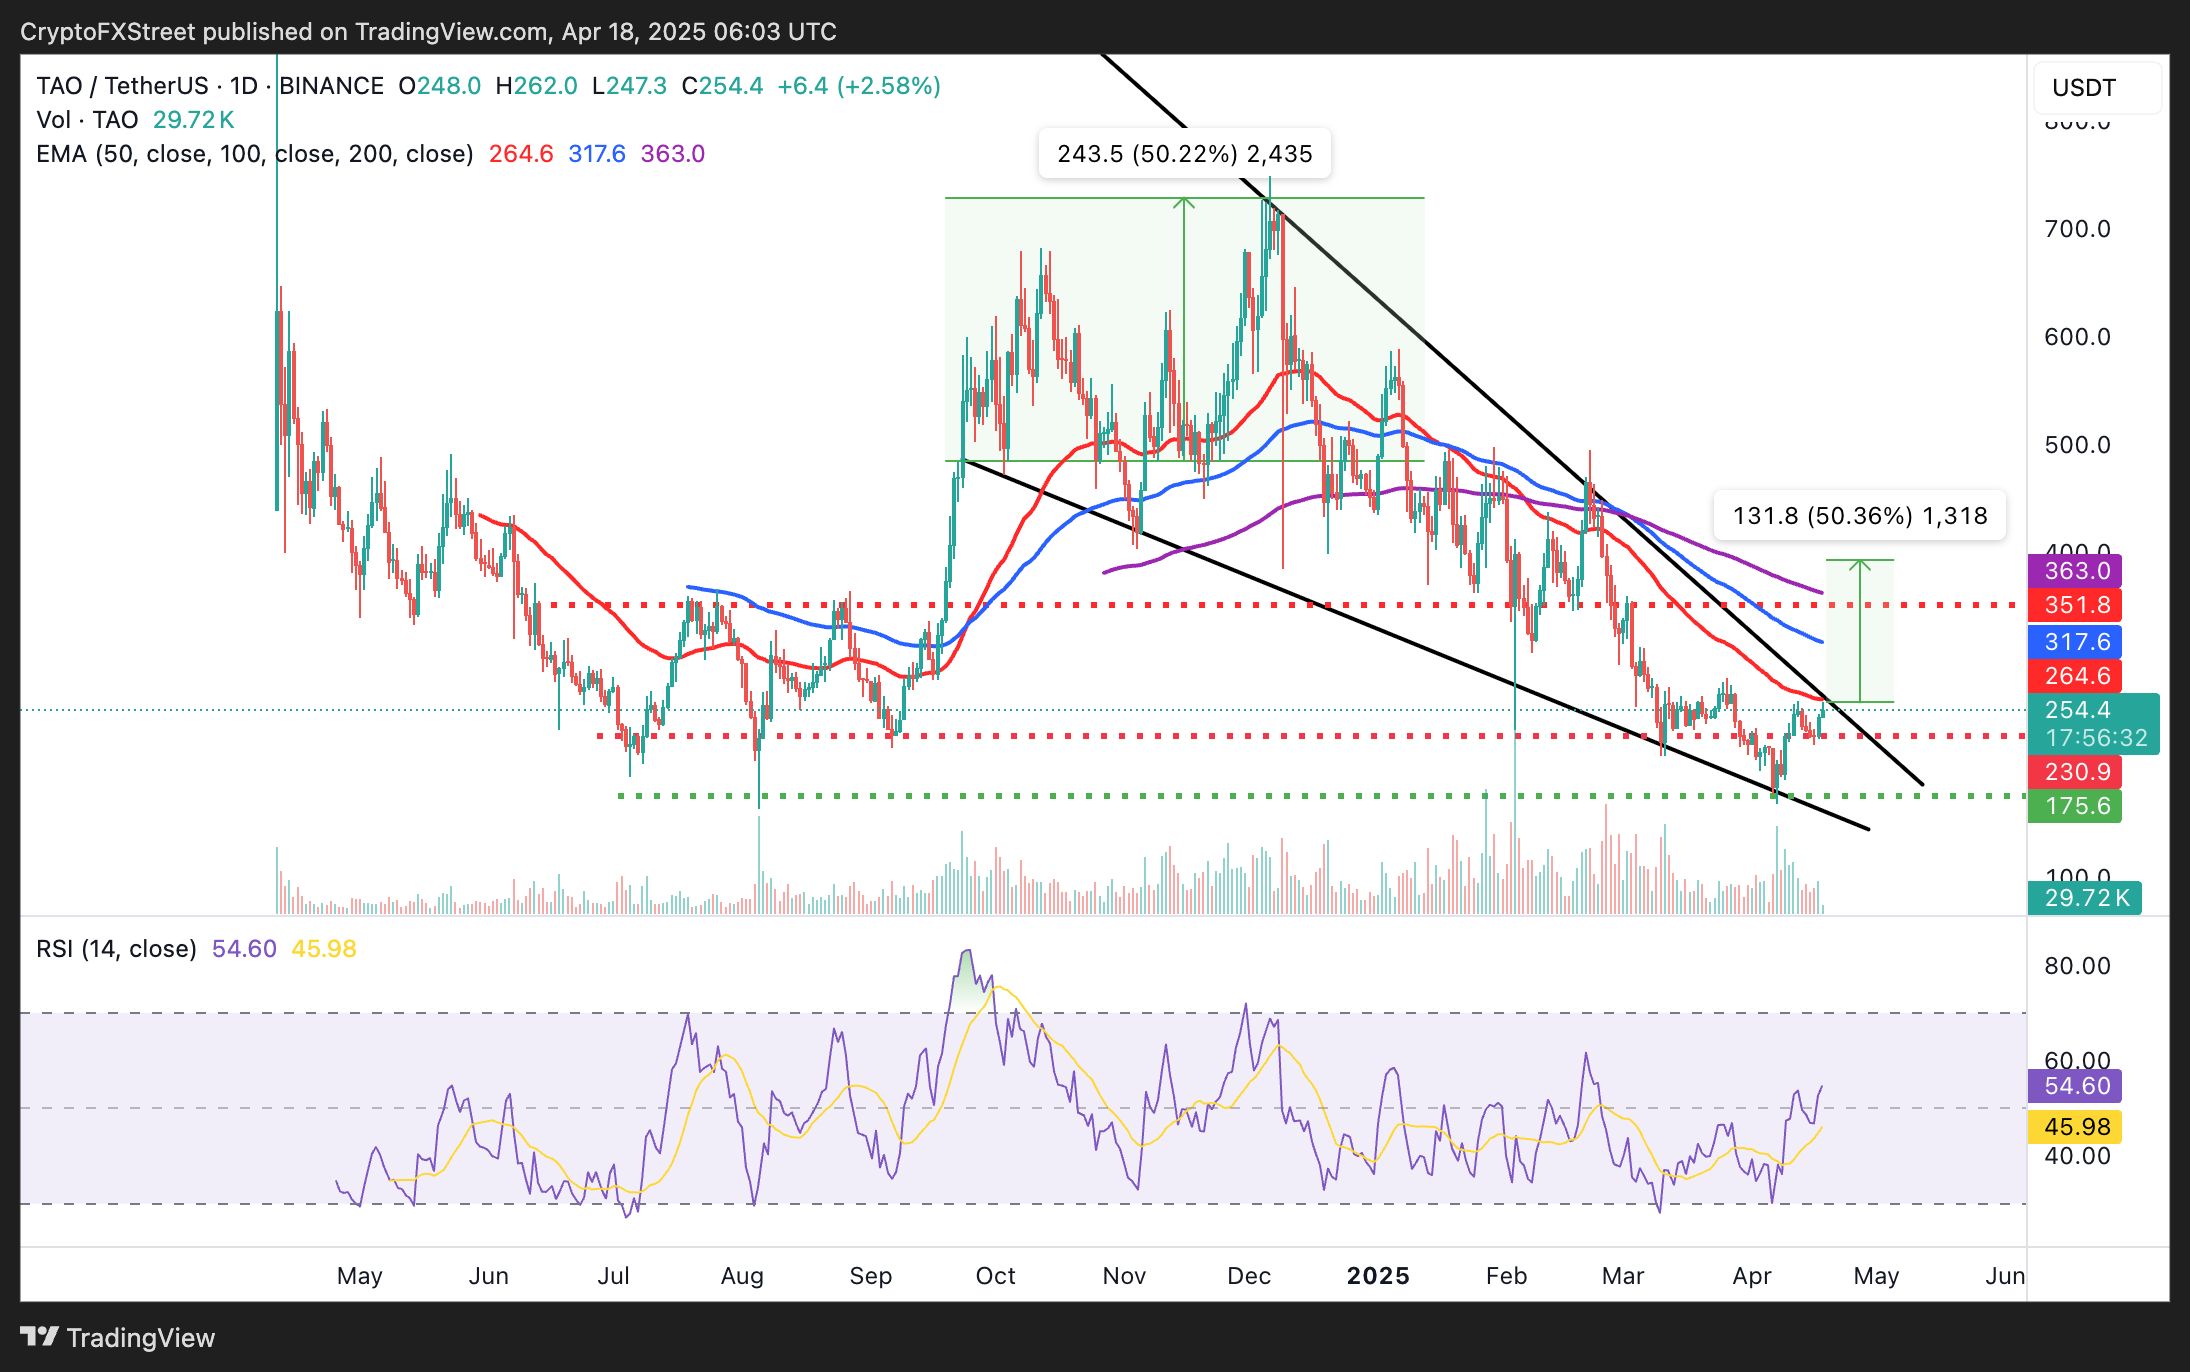
TAO/USDT daily chart
The Relative Strength Index (RSI) indicator’s position at 54.46 affirms the bullish outlook. As it rises in the upper neutral region toward the overbought region, more traders would be encouraged to buy TAO, thus increasing demand and bullish momentum.
Render reclaims the 50-day EMA support
Render bounced off the descending channel’s lower boundary in March, setting a precedent for the bulls, who later reclaimed support at the pattern’s mid-level. Although volatility caused by President Trump’s tariffs created some instability, this support remained intact, ensuring bulls have the upper hand.
Now that RNDR has broken out of the descending channel and is sitting on top of support provided by the 50-day EMA at $3.75, the next leg up may push the price past the 200-day EMA at $5.17.
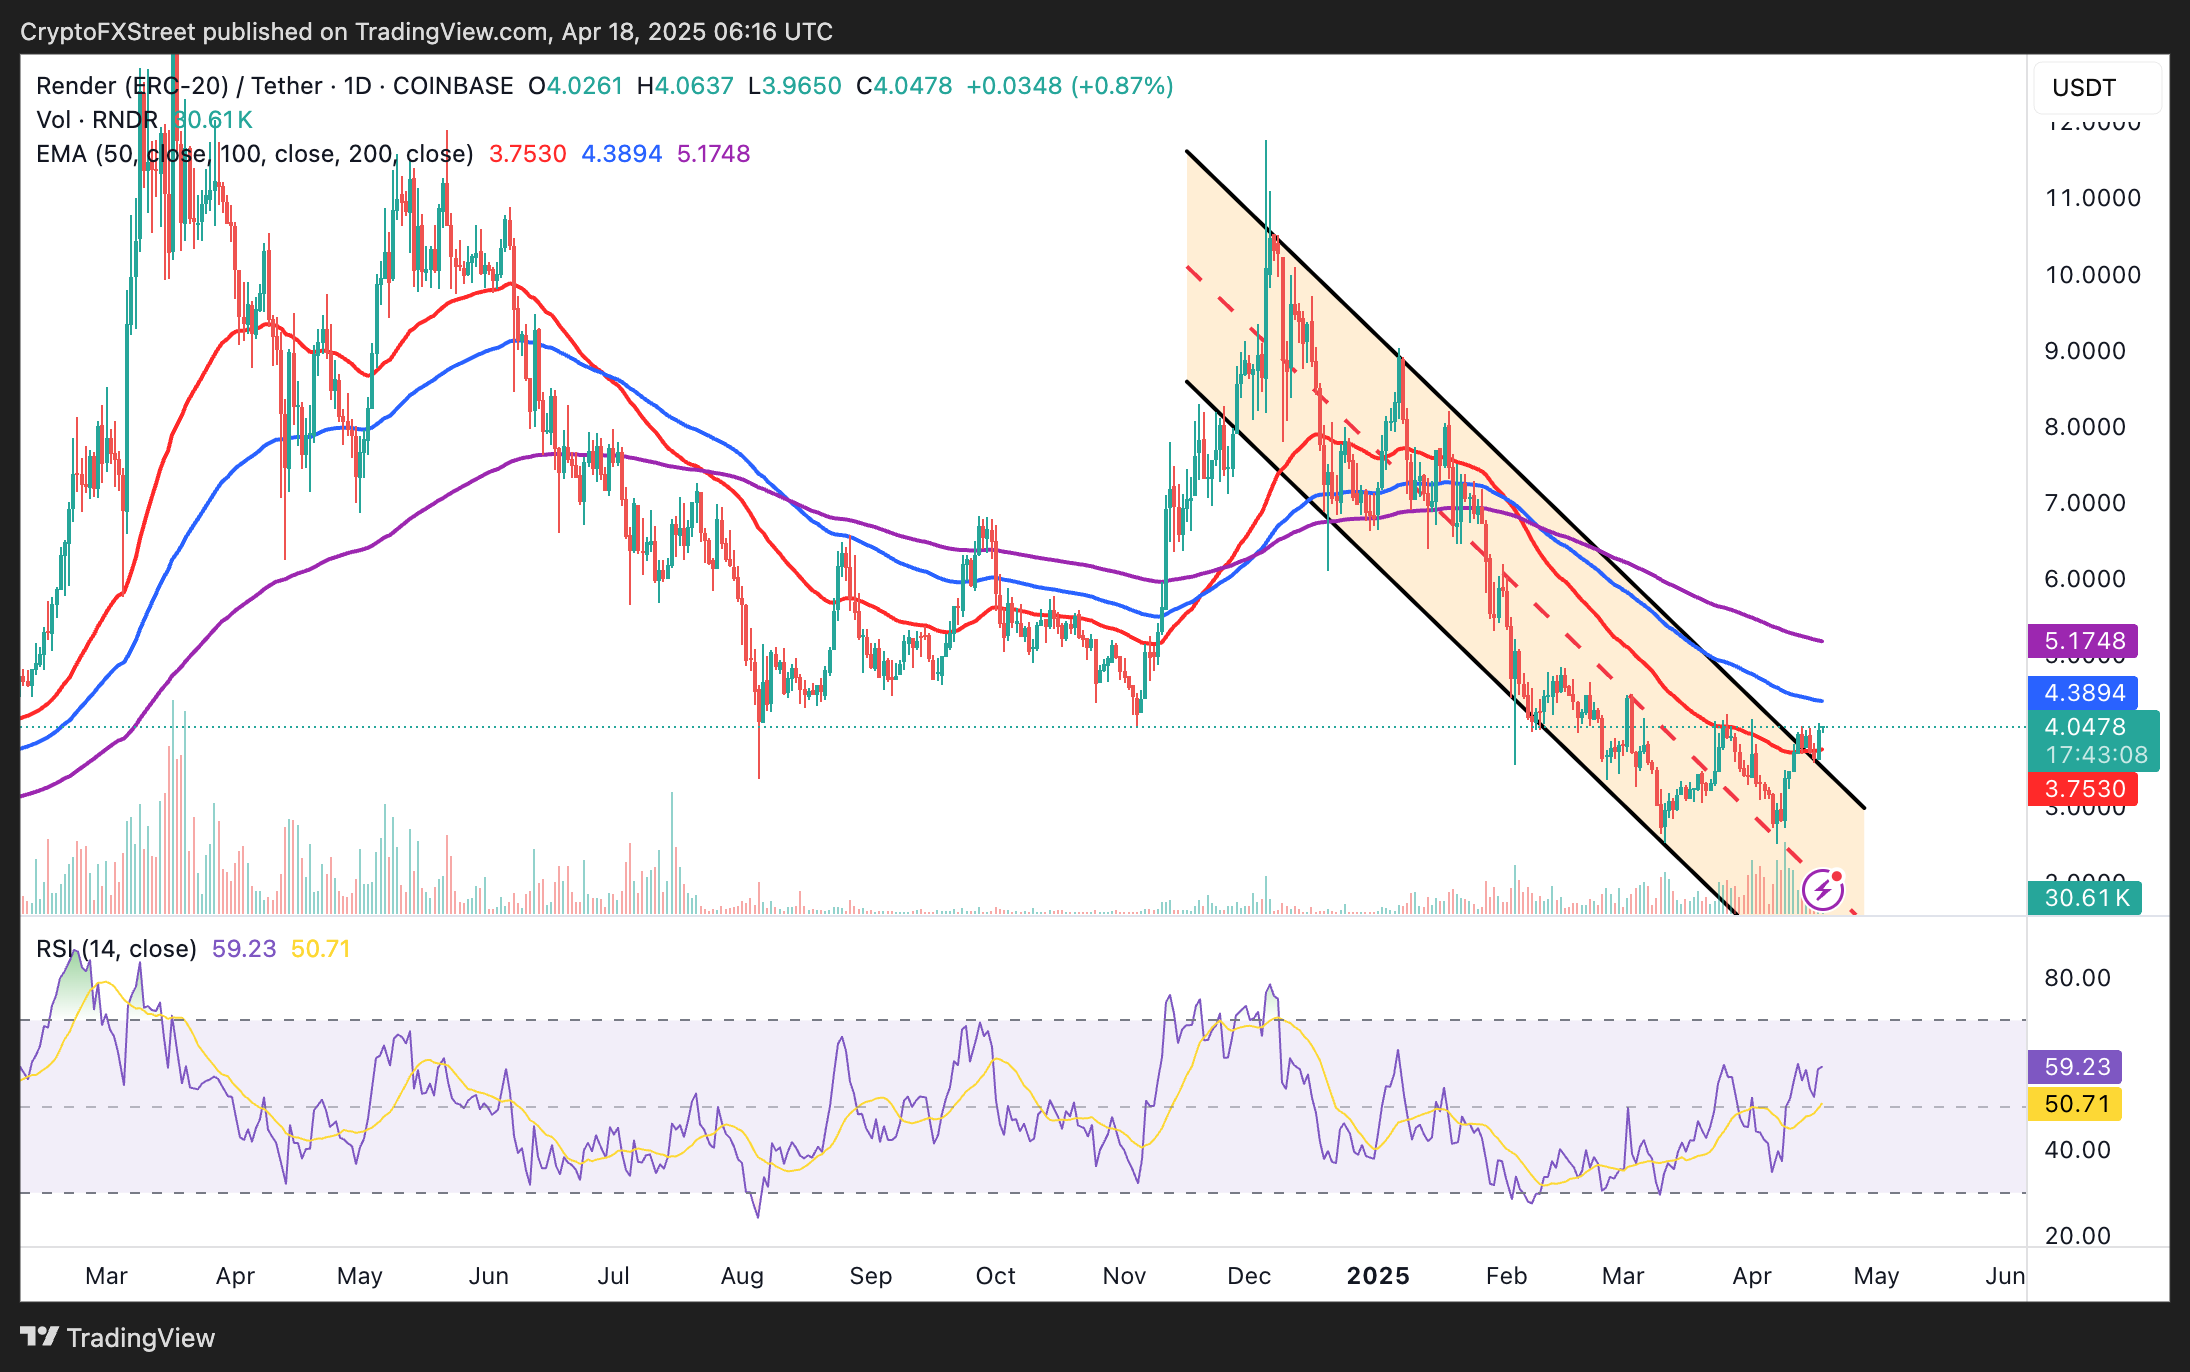
RNDR/USDT daily chart
The rising RSI indicator at 59 toward the overbought territory indicates increasing bullish momentum and a stronger outlook in the coming sessions. However, it also approaches a point where the asset may be overvalued (above 70), risking a pullback.
AIOZ Network consolidates ahead of breakout
AIOZ dodderers at $0.27 at the time of writing, reflecting a 1.27% decline in the day. Profit-taking activities have put the bullish momentum to the test in the last 24 hours. The 50-day EMA at $0.30 and the long-term support turned resistance at $0.35 highlight potential pain points, which could explain why traders book early profits.
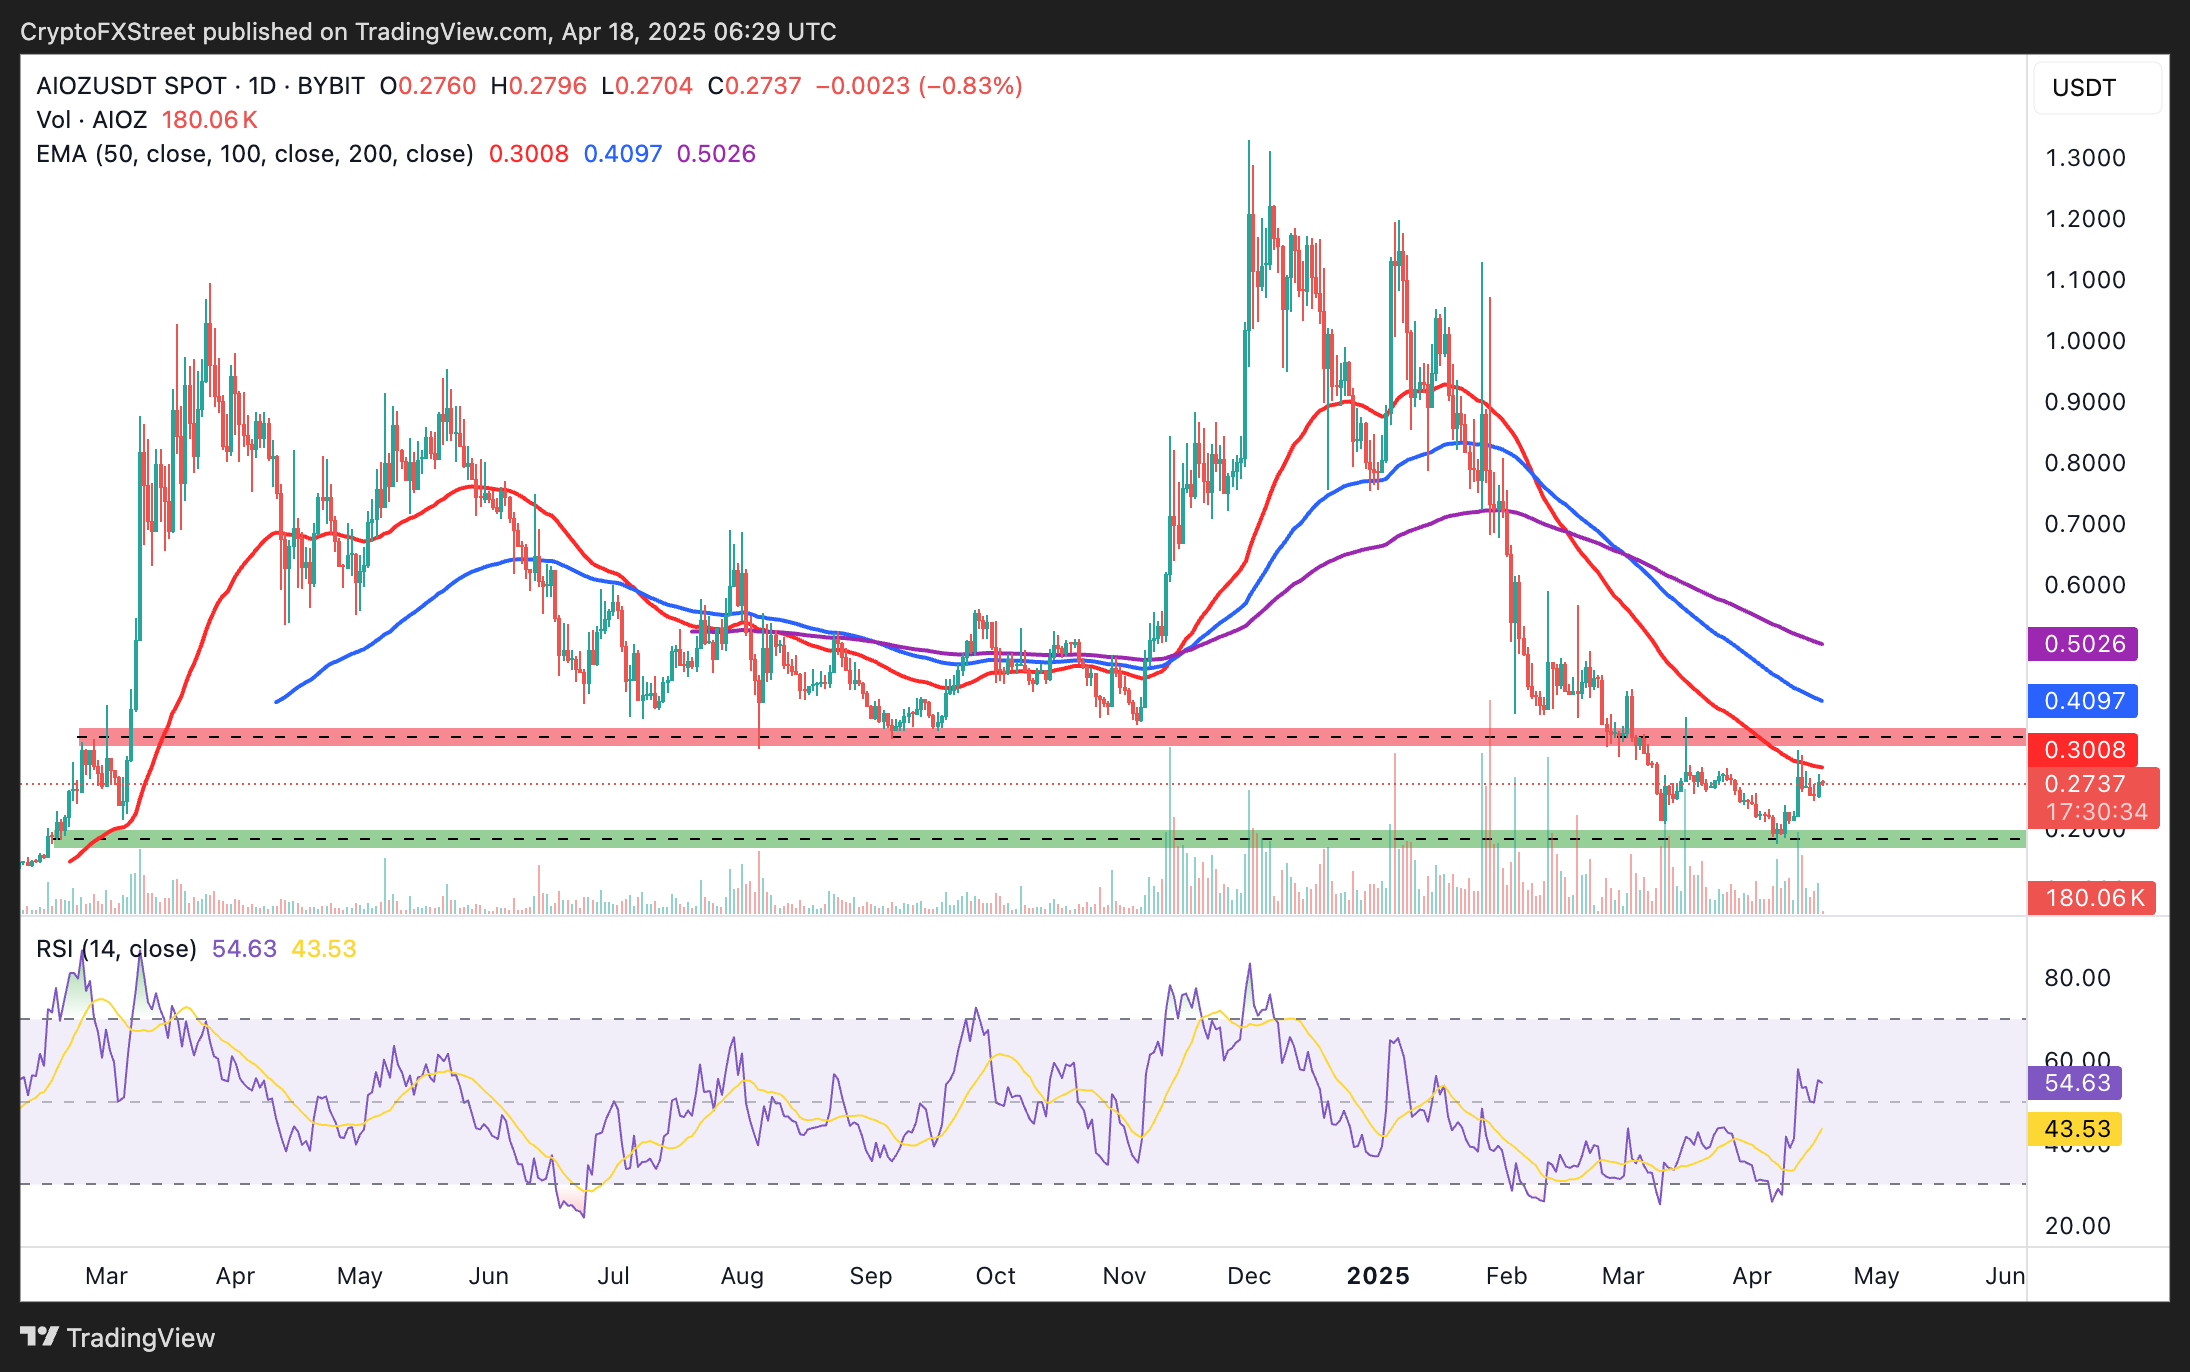
AIOZ/USDT daily chart
Despite the hurdles, the RSI signals a stronger bullish outlook at 54. Traders may want to watch out for the indicator’s direction to affirm the uptrend eyeing $0.35 or a sell-off testing AIOZ $0.18 support, tested in February 2024.
At a global level, Federal Reserve Chairman Jerome Powell has warned of a larger-than-expected impact of President Trump's tariffs. Powell foresees higher inflation in the United States, which would warrant higher interest rates and ultimately slow economic growth. In light of this outlook, digital assets may suffer from declining liquidity, likely extending the drawdowns.
Cryptocurrency prices FAQs
Token launches influence demand and adoption among market participants. Listings on crypto exchanges deepen the liquidity for an asset and add new participants to an asset’s network. This is typically bullish for a digital asset.
A hack is an event in which an attacker captures a large volume of the asset from a DeFi bridge or hot wallet of an exchange or any other crypto platform via exploits, bugs or other methods. The exploiter then transfers these tokens out of the exchange platforms to ultimately sell or swap the assets for other cryptocurrencies or stablecoins. Such events often involve an en masse panic triggering a sell-off in the affected assets.
Macroeconomic events like the US Federal Reserve’s decision on interest rates influence crypto assets mainly through the direct impact they have on the US Dollar. An increase in interest rate typically negatively influences Bitcoin and altcoin prices, and vice versa. If the US Dollar index declines, risk assets and associated leverage for trading gets cheaper, in turn driving crypto prices higher.
Halvings are typically considered bullish events as they slash the block reward in half for miners, constricting the supply of the asset. At consistent demand if the supply reduces, the asset’s price climbs.
บทความแนะนำ


