


Bitcoin Price Forecast: BTC bears gain momentum as Trump’s tariff uncertainty hits the market
- Bitcoin price edges below $82,000 on Monday after falling 4.29% the previous week.
- BTC’s first quarter return so far is -12.51%, the fourth lowest Q1 overall since 2013.
- The EPU index reads 600, 80% higher than during the 2008 Global Financial Crisis, signaling extreme market unease and risk-off sentiment.
Bitcoin (BTC) price edges below $82,000 at the time of writing on Monday after falling 4.29% the previous week. BTC’s first quarter return for this year so far is -12.51%, the fourth lowest Q1 overall since 2013. Meanwhile, the US Economic Policy Uncertainty (EPU) Index reads 600, 80% higher than during the 2008 Global Financial Crisis, signaling extreme market unease and risk-off sentiment.
Risk-off sentiment and market uncertainty escalate amid Trump’s tariff deadline
Bitcoin price continues its correction on Monday, trading below $82,000 after falling 4.29% the previous week. The risk-off sentiment and market uncertainty escalate ahead of US President Donald Trump’s tariff deadline, the so-called ‘Liberation Day,’ on Wednesday. The reports from K33 Research and Kobeissi caution traders to anticipate increased volatility.
Moreover, the US Economic Policy Uncertainty (EPU) Index chart below, which measures uncertainty in US economic policy since 1985, currently stands over 600 — 80% higher than during the 2008 Global Financial Crisis, signaling extreme market unease. Historical spikes in the metric indicate high uncertainty often precedes significant market volatility, as seen during the 2008 crisis and the 2020 COVID-19 shutdown.
This high uncertainty and volatility market condition often precedes a risk-off sentiment in investors as they migrate toward safer assets like Gold, potentially dampening crypto demand.
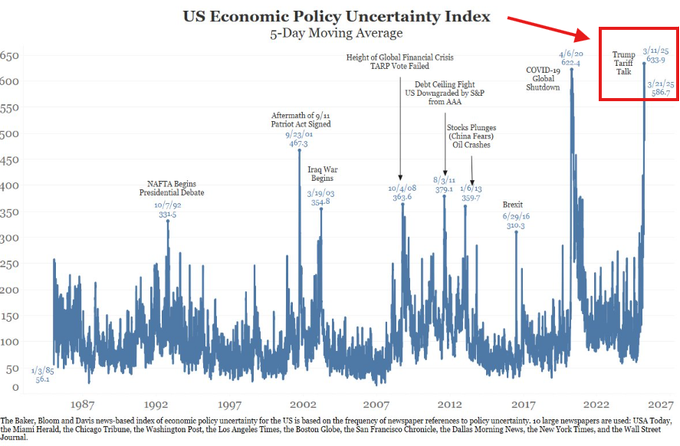
US Economic Policy Uncertainty Index Chart
On Monday, the Wall Street Journal (WSJ) reported that President Trump’s team is considering “broader and higher tariffs” ahead of Wednesday’s reciprocal tariffs deadline.
President Trump reportedly weighs “an across-the-board hike of up to 20%.” Again, Wednesday is not just the end of tariff uncertainty, according to a post from the Kobeissi Letter on X.
As uncertainty and volatility hit the global and crypto markets, volatility with potential sell-offs as risk-off sentiment dominates for crypto markets in the short term. However, over the medium to long term, Bitcoin and other cryptos could benefit from increased demand as hedges against inflation and economic uncertainty, especially if inflation rises and traditional markets falter. The historical correlation between EPU shocks and crypto volumes, alongside Bitcoin’s “haven asset” perception, supports this outlook, though short-term risks remain significant due to broader market dynamics.
To gain more insight into how crypto markets would react to these tariff policies, FXStreet interviewed some experts in the crypto markets in this report.
Bitcoin’s quarterly return is negative, while April historical monthly return suggests a mild recovery
According to Coinglass Bitcoin Quarterly returns (%) data, BTC Q1 shows negative returns this year, -12.51%, the worst Q1 since 2018 and the fourth lowest overall Q1 since 2013.
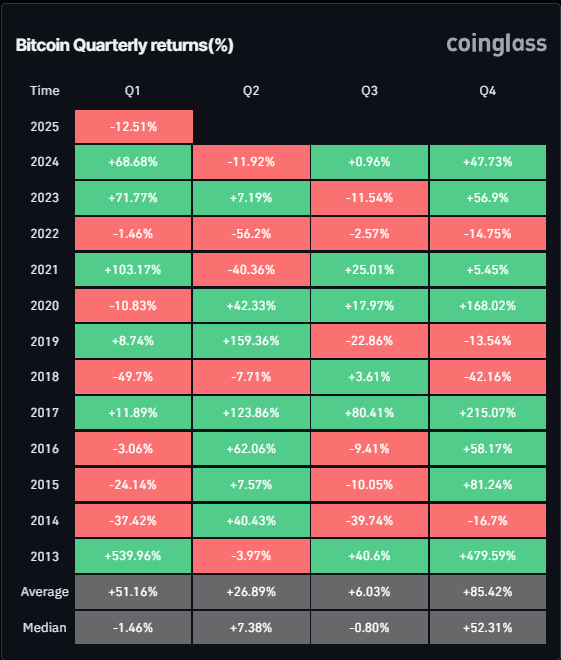
BTC Quarterly returns (%) chart. Source: Coinglass
Looking at the monthly return chart below, March has registered a mild correction so far of 3.06%, while April historical data shows that the monthly average and median returns show positive gains of 12.98% and 5.04%, respectively, hinting at some optimism.
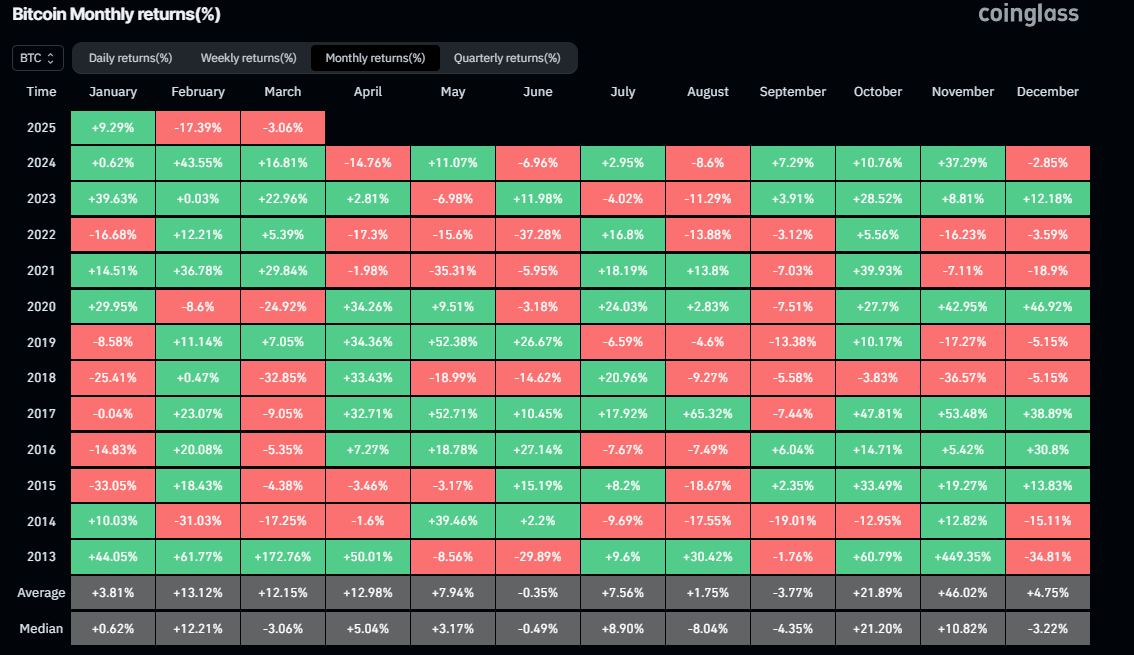
Bitcoin Monthly returns(%) chart. Source: Coinglass
Bitcoin’s institutional demand data shows a diminishing demand for BTC. According to Coinglass, Bitcoin spot Exchange Traded Fund (ETF) data recorded a mild net inflow of $196.40 million last week after $744.30 million of inflows the previous week. These inflows are quite small compared to inflows seen during early November. For Bitcoin’s price to recover further, the demand from institutional investors should rise and intensify.
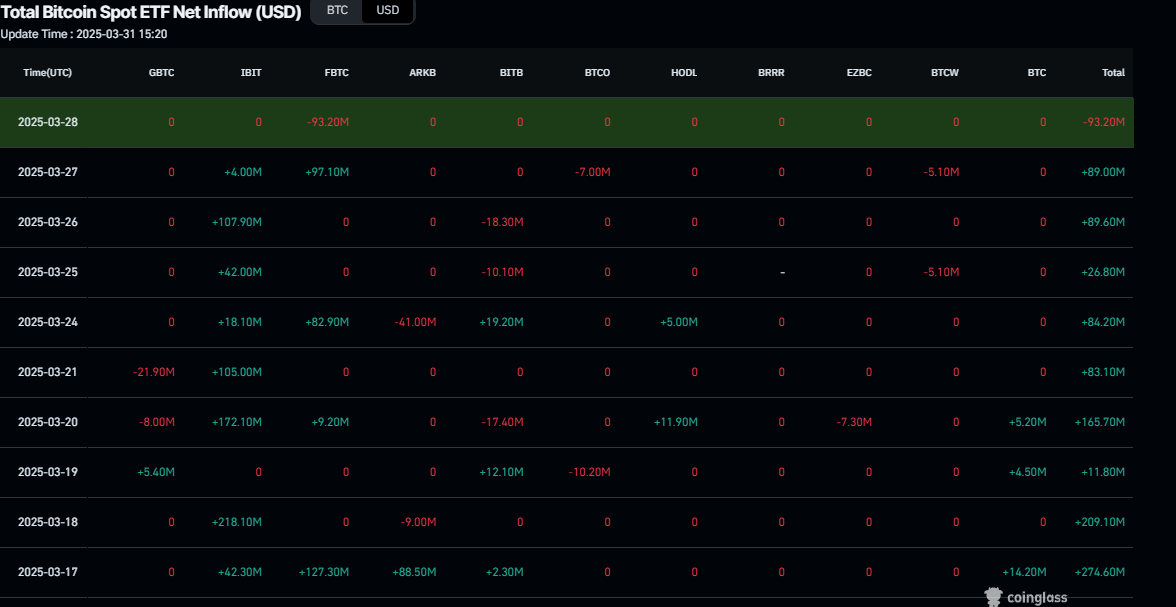
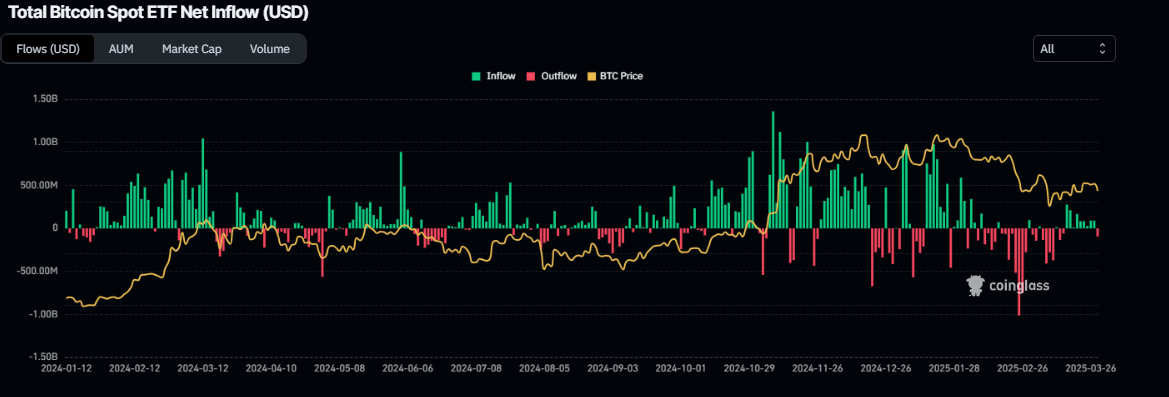
Total Bitcoin spot ETF net inflow chart. Source: Coinglass
Bitcoin Price Forecast: BTC bears take the lead
Bitcoin’s price was consolidating between $85,000 and $88,000 last week. However, it closed below its lower consolidation boundary on Friday and declined 5.53% until Sunday. At the time of writing on Monday, it continues to trade down below $82,000.
If BTC continues to correct, it could extend the decline to retest its next support level at $78,258.
The Relative Strength Index (RSI) indicator on the daily chart reads 40, below its neutral level of 50, and points downward, indicating strong bearish momentum.
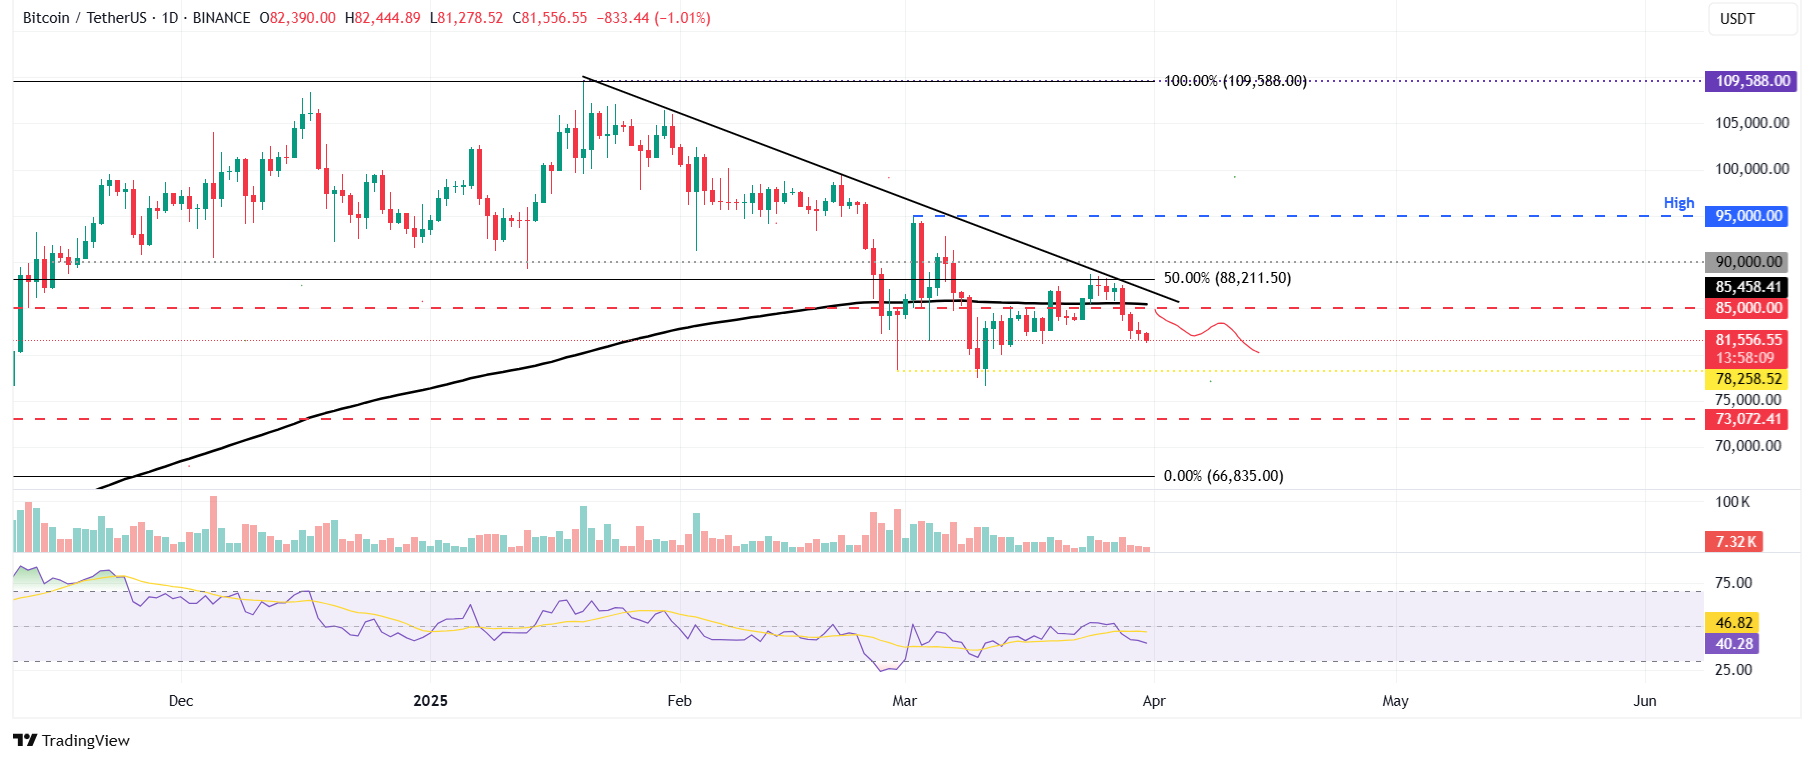
BTC/USDT daily chart
However, if BTC recovers, it could retest its daily resistance at $85,000. A successful break above this level could extend the recovery rally to the key psychological level of $90,000.
Bitcoin, altcoins, stablecoins FAQs
Bitcoin is the largest cryptocurrency by market capitalization, a virtual currency designed to serve as money. This form of payment cannot be controlled by any one person, group, or entity, which eliminates the need for third-party participation during financial transactions.
Altcoins are any cryptocurrency apart from Bitcoin, but some also regard Ethereum as a non-altcoin because it is from these two cryptocurrencies that forking happens. If this is true, then Litecoin is the first altcoin, forked from the Bitcoin protocol and, therefore, an “improved” version of it.
Stablecoins are cryptocurrencies designed to have a stable price, with their value backed by a reserve of the asset it represents. To achieve this, the value of any one stablecoin is pegged to a commodity or financial instrument, such as the US Dollar (USD), with its supply regulated by an algorithm or demand. The main goal of stablecoins is to provide an on/off-ramp for investors willing to trade and invest in cryptocurrencies. Stablecoins also allow investors to store value since cryptocurrencies, in general, are subject to volatility.
Bitcoin dominance is the ratio of Bitcoin's market capitalization to the total market capitalization of all cryptocurrencies combined. It provides a clear picture of Bitcoin’s interest among investors. A high BTC dominance typically happens before and during a bull run, in which investors resort to investing in relatively stable and high market capitalization cryptocurrency like Bitcoin. A drop in BTC dominance usually means that investors are moving their capital and/or profits to altcoins in a quest for higher returns, which usually triggers an explosion of altcoin rallies.
บทความแนะนำ


