
LOOM price prediction 2025-2031: Is the Loom Network a good investment?
Key Takeaways
- LOOM price prediction suggests that LOOM price will rise to $0.0672 by the end of 2025
- In 2028, LOOM is expected to reach a new high of approximately $0.2213, driven by increased adoption and development within the blockchain space.
- Looking ahead to 2031, LOOM could witness a significant surge, with its price potentially climbing to around $0.6509, reflecting long-term growth potential.
Despite periods of market volatility and ongoing challenges in the regulatory landscape, LOOM Network has proven to be a resilient project. Focusing on enhancing scalability for decentralized applications (dApps) and gaming platforms, LOOM continues to position itself as a vital contributor to blockchain infrastructure. Its value proposition is facilitating efficient, fast transactions, positioning LOOM as a strong contender in the evolving blockchain ecosystem.
Overall, the sentiment within the LOOM Network community remains cautiously optimistic as stakeholders monitor the project’s advancements and market performance. As LOOM continues to enhance its scalability and attract partnerships, its price potential invites further analysis and exploration of future opportunities.
Overview
| Cryptocurrency | Loom Network |
| Symbol | LOOM |
| Price | $0.04288 |
| Market Cap | $53.31M |
| Trading Volume 24-h | $1.9M |
| Circulating Supply | 1.24B LOOM |
| All-time High | $0.7745, May 04, 2018 |
| All-time Low | $0.00767, Mar 13, 2020 |
| 24-h High | $0.04326 |
| 24-h Low | $0.04172 |
LOOM Network price prediction: Technical analysis
| Volatility | 4.87% |
| Sentiment | Bearish |
| 50-Day SMA | $ 0.052314 |
| 200-Day SMA | $ 0.056979 |
| Price prediction | $ 0.065047 (52.46%) |
| F & G Index | 20 (Fear) |
| Green days | 13/30 (43%) |
| 14-day RSI | 26.90 |
Loom Network analysis: LOOM price action and market trends
TL; DR Breakdown:
- LOOM holds support trading at $0.04324, with support at $0.04098 and resistance at $0.045, showing short-term bullish momentum.
- The MACD is positive, the RSI is at 57.53, and the Bollinger Bands suggest low volatility and possible consolidation.
- Moving averages favor a bullish short-term trend, but the long-term outlook remains bearish.
The LOOM Network price analysis for today, March 6. LOOM is trading at $0.04324, marking a 1.47% increase over the last 24 hours. The cryptocurrency experienced a daily low of $0.04098 and a high of $0.04325, reflecting modest price fluctuations. The token has recently migrated to a new contract address, and users are advised to verify compatibility before conducting transactions. According to CoinMarketCap data, the project maintains an average user rating of 3.6 stars.
Loom analysis on the daily timeframe: Bullish reversal signals strength as LOOM holds key support levels
LOOM’s daily price chart shows a mixed trend, with early downward pressure followed by a strong recovery. The price initially dipped below $0.045, reflecting bearish momentum, before stabilizing and reversing toward the upside. A key support zone was tested near $0.04098, where buyers stepped in, preventing further downside movement. The resistance at $0.04325 was briefly tested, and the current price of $0.04324 suggests continued bullish sentiment.
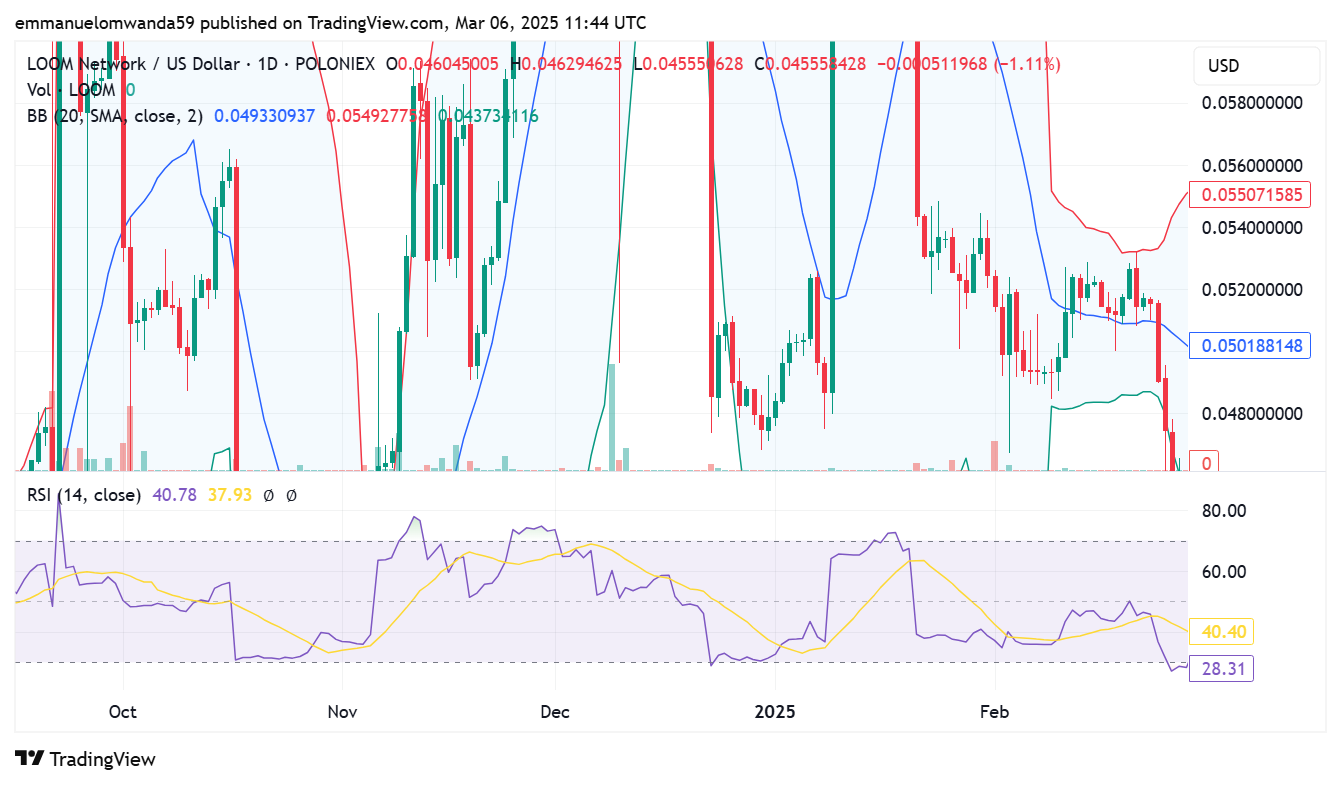
The EMAs are above the mean position, with their gradient turning negative as the price level falls. The RSI also supports this sentiment, falling to 28.31 above the 70.00 level. The converging Bollinger Bands suggest lower volatility, indicating that the $0.0549 support may hold for the week.
Loom analysis on the 4-Hour: LOOM maintains an uptrend as buyers target key resistance levels
The 4-hour price chart of LOOM shows a sharp decline as the price fell from above the $0.045 mark to the $0.04098 support. Moreover, the lack of strong support between the $0.04098 and the $0.04325 mark makes a quick recovery difficult.
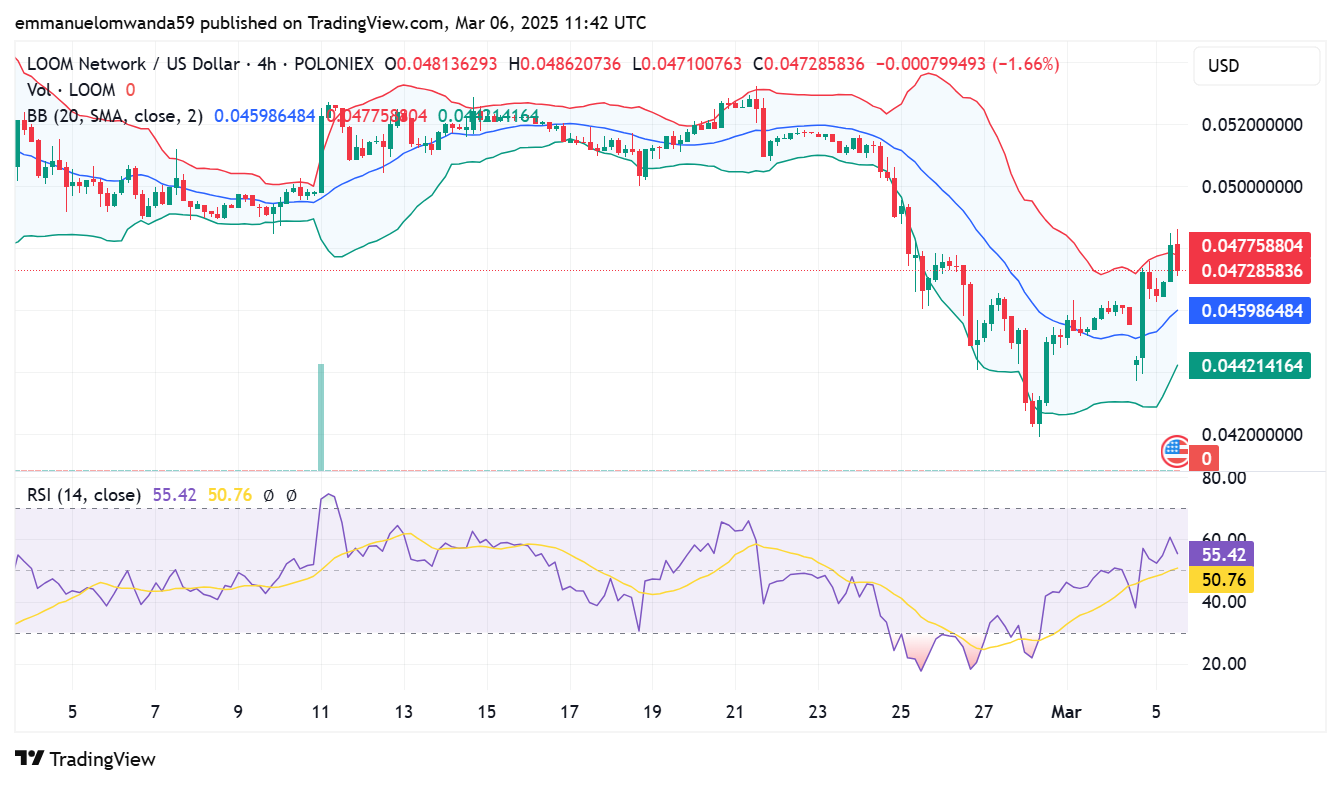
The Bollinger Bands show expanding volatility, suggesting potential for further movement. If buying pressure is sustained, LOOM could attempt to break the $0.042 level soon. A drop below $0.040 could invalidate the bullish outlook, leading to a retest of lower supports.
LOOM Network technical indicators: Levels and actions
Daily simple moving average (SMA)
| Period | Value | Action |
| SMA 3 | $ 0.054035 | SELL |
| SMA 5 | $ 0.05019 | SELL |
| SMA 10 | $ 0.047434 | SELL |
| SMA 21 | $ 0.047995 | SELL |
| SMA 50 | $ 0.052314 | SELL |
| SMA 100 | $ 0.059002 | SELL |
| SMA 200 | $ 0.056979 | SELL |
Daily exponential moving average (EMA)
| Period | Value | Action |
| EMA 3 | $ 0.04856 | SELL |
| EMA 5 | $ 0.051281 | SELL |
| EMA 10 | $ 0.055455 | SELL |
| EMA 21 | $ 0.058688 | SELL |
| EMA 50 | $ 0.061122 | SELL |
| EMA 100 | $ 0.060996 | SELL |
| EMA 200 | $ 0.062786 | SELL |
What can you expect from a LOOM Network price analysis?
LOOM Network trades at $0.04324, up 1.47%, with support at $0.04098 and resistance at $0.045. On the 4-hour chart, LOOM holds an uptrend but lacks strong support between $0.04098 and $0.04325. A push above $0.044 is possible, while a drop below $0.040 could trigger further losses. Short-term moving averages remain bullish, but long-term signals show weakness.
Is LOOM Network a good investment?
LOOM Network is a blockchain platform designed to enhance scalability and efficiency for decentralized applications, particularly in gaming and dApps. The network has consistently made progress in its development, offering fast transactions with minimal costs. While the market has faced some volatility, future price predictions for LOOM remain optimistic, pointing to potential growth as the adoption of decentralized technologies continues to rise.
Will LOOM reach $0.10?
Yes, LOOM can reach $0.10 in the year 2026, per expert predictions.
Will LOOM reach $0.20?
Based on long-term forecasts, LOOM is projected to reach $0.20 by 2028 as its ecosystem and user adoption continue to grow.
Does LOOM have a good long-term future?
LOOM Network’s (LOOM) long-term prospects remain uncertain, hinging on its ability to adapt to technological advancements, market demand, and the evolving blockchain industry. While the token shows potential, its success will depend on navigating these challenges and capitalizing on opportunities in the coming years.
LOOM price prediction March 2025
According to our LOOM price prediction for March 2025, we expect a minimum price of $0.0409 and an average price of $0.0452. However, if LOOM’s growth trajectory persists, we predict its value could reach as high as $0.0465 at its peak.
| Month | Minimum Price | Average Price | Maximum Price |
| March | $0.0409 | $0.0452 | $0.0465 |
LOOM price prediction 2025
According to our LOOM price prediction for 2025, we expect a minimum price of $0.0595 and an average price of $0.0613. However, if LOOM’s growth trajectory persists, its value could reach as high as $0.0672 at its peak
| Year | Minimum Price | Average Price | Maximum Price |
| 2025 | $0.0595 | $0.0613 | $0.0672 |
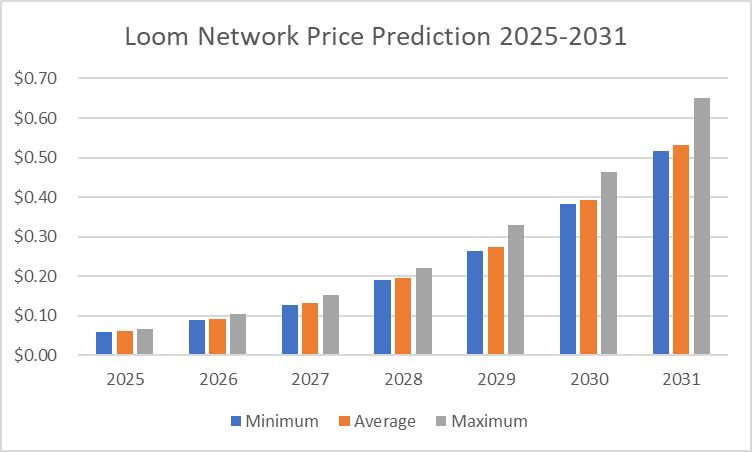
LOOM price prediction 2026-2031
| Year | Minimum Price | Average Price | Maximum Price |
| 2026 | $0.0892 | $0.0916 | $0.1037 |
| 2027 | $0.1272 | $0.1318 | $0.1530 |
| 2028 | $0.1900 | $0.1953 | $0.2213 |
| 2029 | $0.2632 | $0.2729 | $0.3289 |
| 2030 | $0.3818 | $0.3927 | $0.4643 |
| 2031 | $0.5173 | $0.5330 | $0.6509 |
LOOM price prediction 2026
The price of Loom Network is predicted to reach a minimum value of $0.0892 in 2026. The Loom Network price could reach a maximum value of $0.1037 with the average trading price of $0.0916
LOOM price prediction 2027
According to the price prediction for 2027, we expect the coin’s minimum price to be $0.1272 and its average predicted value to be $0.1318. We expect LOOM’s price to surge to a maximum of $0.1530 by 2027.
LOOM Price Prediction 2028
Our LOOM price prediction for 2028 is a minimum value of $0.1900 with an average trading price of $0.1953. Based on this prediction, the price could reach a maximum of $0.2213 during the year.
LOOM price prediction 2029
The price of Loom Network is predicted to reach a minimum value of $0.2632 in 2029. The Loom Network price could reach a maximum value of $0.3289 with an average trading price of $0.27296.
LOOM price prediction 2030
Our LOOM price prediction for 2030 suggests that the minimum price level could be $0.3818. The LOOM token will experience significant growth, with a maximum potential price value of $0.4643 and an average projected value of $0.3927.
LOOM price prediction 2031
According to our LOOM price prediction for 2031, we anticipate that the cryptocurrency’s value may drop to a low of $0.5173 by year-end. However, we expect the average trading price to be $0.5330 and the maximum estimated price to reach as high as $0.6509.
LOOM market price prediction: Analysts’ LOOM price forecast
| Firm | 2025 | 2026 |
| Coincodex | $0.098 | $ 0.14 |
| DigitalCoinPrice | $0.0939 | $0.11 |
Cryptopolitan’s LOOM Network (LOOM) price prediction
Cryptopolitan’s predictions show that LOOM will achieve a high of $0.0672 in 2025. In 2028, it will range between $0.1900 and $0.2213, with an average of $0.1953. In 2031, it will range between $0.5173 and $0.6509, with an average of $0.5330. Note that the predictions are not investment advice. Seek independent professional consultation or do your research.
LOOM Network historic price sentiment
- The Loom Network’s smart contracts and dApps are powered by the LOOM token. It has been connected with Binance Chain and is an ERC-20 token that can also be used as a BEP-2 token. LOOM is not yet intended to become a native token.
- The LOOM market is also unique because there has never been a public ICO. Instead, the team conducted a private investment round in January 2018 and raised $45,810,000 by selling 750 million LOOM tokens for $0.076 each.
- On May 4, 2018, LOOM reached an all-time high of $0.774454; however, it has since dropped significantly. The LOOM token dropped to an all-time low of $0.007666 on March 13, 2020.
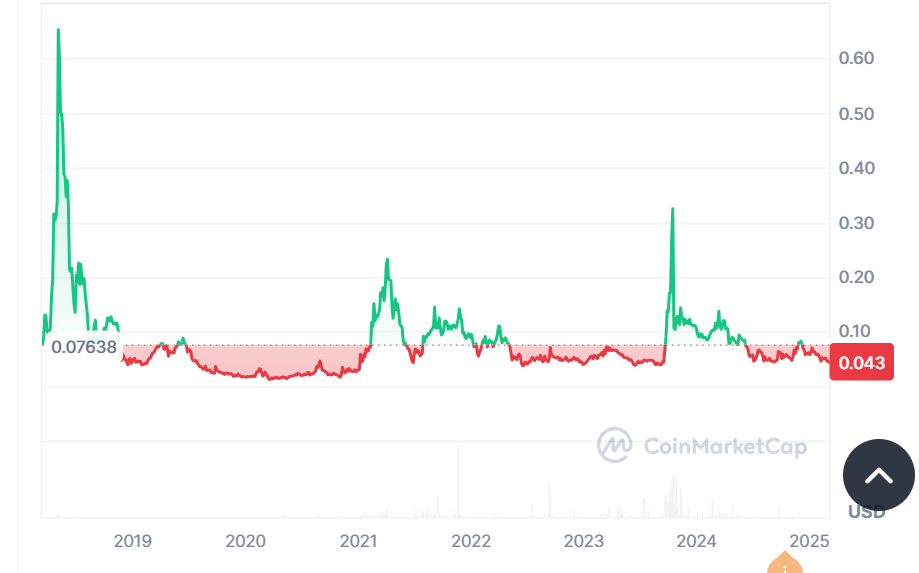
- In 2024, LOOM started trading around the $0.05 – $0.06 range, showing signs of recovery from its lower points in 2023.
- The year began with a relatively stable trajectory, with minimal volatility up until February 2024, when the price spiked to approximately $0.08, reflecting increased interest in the token. However, this surge was short-lived, and LOOM corrected back to $0.06 by March.
- Throughout April and May 2024, LOOM faced consistent resistance, struggling to break past the $0.07 mark. The token remained within a $0.05 – $0.07 range during this period, reflecting lower market momentum.
- The price hovered close to $0.07 by June, with no significant breakthroughs. July saw the token stabilize around the $0.06 range, with low volatility dominating the market. Despite this, LOOM made some gains in August, opening at $0.06 and closing near $0.08, showing bullish signs.
- As of September 2024, LOOM has experienced a notable price surge, briefly spiking to $0.10 before correcting back to $0.06. This suggests the market is still testing resistance levels and could see further volatility in the coming months.
- In November 2024, the price hovered around $0.10, showing resistance at this level.
- Moving into December 2024 and January 2025, the price gradually declined, fluctuating between $0.06 and $0.08.
- By February 2025, the price further dropped, reaching approximately $0.05, signaling lower trading interest or bearish sentiment.
- In March 2025, LOOM continued its downward trend, reaching $0.043, as shown in red on the chart, indicating a period of sustained weakness.
บทความแนะนำ


