
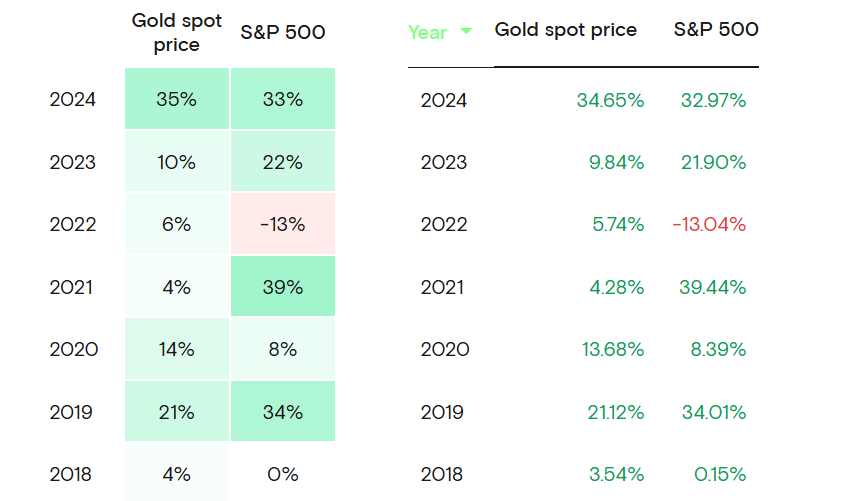
Gold is outperforming the S&P 500, wins 4 out of the last 7 years
Since 2018, gold’s annual returns have outpaced those of the US stock market standard S&P 500 for four of the seven years. According to data from Curvo, the precious metal had an average annualized return of over 40% in 2024, 10% more than the S&P 500.
The price of the precious metal in US dollars went up by 25.5% last year, just barely beating the 25% total return of the S&P 500, which included dividends. Going into 2025, the trend of going up continued. In January alone, gold gained 6.4% and hit new highs, while the S&P 500 only gained 2.8%.
Gold outperformed the S&P 500 in years of economic uncertainty
According to data from Curvo.eu, the S&P 500 led in 2021 and 2019 with higher gains, but gold outperformed during years of economic “scares,” such as 2022 and 2020. Over the last two decades, the precious metal’s spot price has surged by 735.5%, compared to the S&P 500’s 848.1% increase.
Still, gold’s lower compound annual growth rate in the last 12 months (7.14% vs. 11.29%) and Sharpe ratio (0.46 vs. 0.69) spells the S&P 500’s historically better risk-adjusted returns.
In early February, gold advocate Peter Schiff stated that when adjusted for the precious metal, the S&P 500 is worth less than 2.1 ounces. Schiff also pointed out that the drop in value is more pronounced when compared to the values recorded from the start of the century, when it was valued at 4.85 ounces.
“So in real terms, the S&P is down 57% over the past 24 years. The nominal gain is all due to inflation,” the Europac chair concluded.
Another gold enthusiast, Jordan Roy-Byrne, also noted on Wednesday that it closed at its second-highest level against the S&P 500 in four years and reached a 22-month high against the Nasdaq.
Gold is Making Progress Against Stocks
— Jordan Roy-Byrne CMT, MFTA ⛏⛏ (@TheDailyGold) March 5, 2025
vs. S&P 500, 2nd highest close in 4 years
vs. Nasdaq, highest close in 22 months
vs. Equal Weight S&P 500, backtest of breakout
If this is the start of Gold outperforming the S&P 500 for a while…look out above over next 12-24 months. pic.twitter.com/AHtSeihF0X
Byrne shared a chart on his post that showed gold recently backtested a breakout against the equal-weighted S&P 500, which he predicted may help continue its stock market outperformance.
Prices peaked in February; trade war concerns may boost prices further
Gold remained near record highs at $2,920 per ounce on Thursday against the backdrop of a weakening US dollar. President Donald Trump announced a temporary one-month exemption for US automakers from his newly imposed 25% tariffs on Canada and Mexico, which could create time for investors to take buying positions in the precious metal.
Trump also signaled potential adjustments to the trade measures, while a US official suggested that the 10% tariff on Canadian energy imports could be removed for certain products meeting trade agreement standards.
US tariffs on trade partners have led to retaliatory actions. China has filed a revised request for consultation with the World Trade Organization about the tariffs. Trade disputes that are still going on have made the market uncertain, which has caused traders to move their money from the stock market to gold.
Lower interest rates boost gold prices by reducing the opportunity cost of holding non-yielding assets. Still, geopolitical uncertainty and trade disruptions have had an even stronger impact on the increased demand for the metal.
On Tuesday, President Trump imposed fresh tariffs on the United States’ top three trading partners: Canada, Mexico, and China. The 25% duties on imports from Canada and Mexico, along with the 10% tariff on Chinese goods, have raised concerns about higher inflation and slower economic growth.
“Unless there is a fresh direction catalyst, the current bearish price action may drag gold lower. Should prices break below $2,900, this may signal further downside toward $2,880,” Lukman Otunuga, senior research analyst at FXTM, told Reuters.
Cryptopolitan Academy: Coming Soon - A New Way to Earn Passive Income with DeFi in 2025. Learn More
บทความแนะนำ


