
Pepe Price Forecast: PEPE bears target double-digit drop amid market weakness
- Pepe price is extending its decline on Tuesday after falling more than 18% the previous day.
- On-chain data shows that PEPE’s daily active addresses and trading volume are falling, indicating a bearish picture.
- The technical outlook suggests a further correction targeting a double-digit drop.
Pepe (PEPE) price extends its decline and trades around $0.0000068 on Tuesday after falling more than 18% the previous day. On-chain data support the bearish outlook as PEPE’s daily active addresses and trading volume are falling. The technical outlook suggests a further correction targeting a double-digit drop.
Pepe price breaks below the ascending trendline, signaling further weakness
Pepe price broke below the ascending trendline (drawn by connecting multiple lows since mid-April) on Feburary 24. However, it retested this broken trendline on Sunday and faced a rejection, declining 18.12% on Monday. At the time of writing on Tuesday, it continues its decline, trading at around $0.0000068.
If Pepe continues its downward momentum, it could extend its decline by 16% from its current trading levels to retest its August 5 low of $0.0000058.
The Relative Strength Index (RSI) on the daily chart reads 33 after rejecting around its neutral level of 50 and approaching its oversold level of 30, indicating a strong bearish momentum.
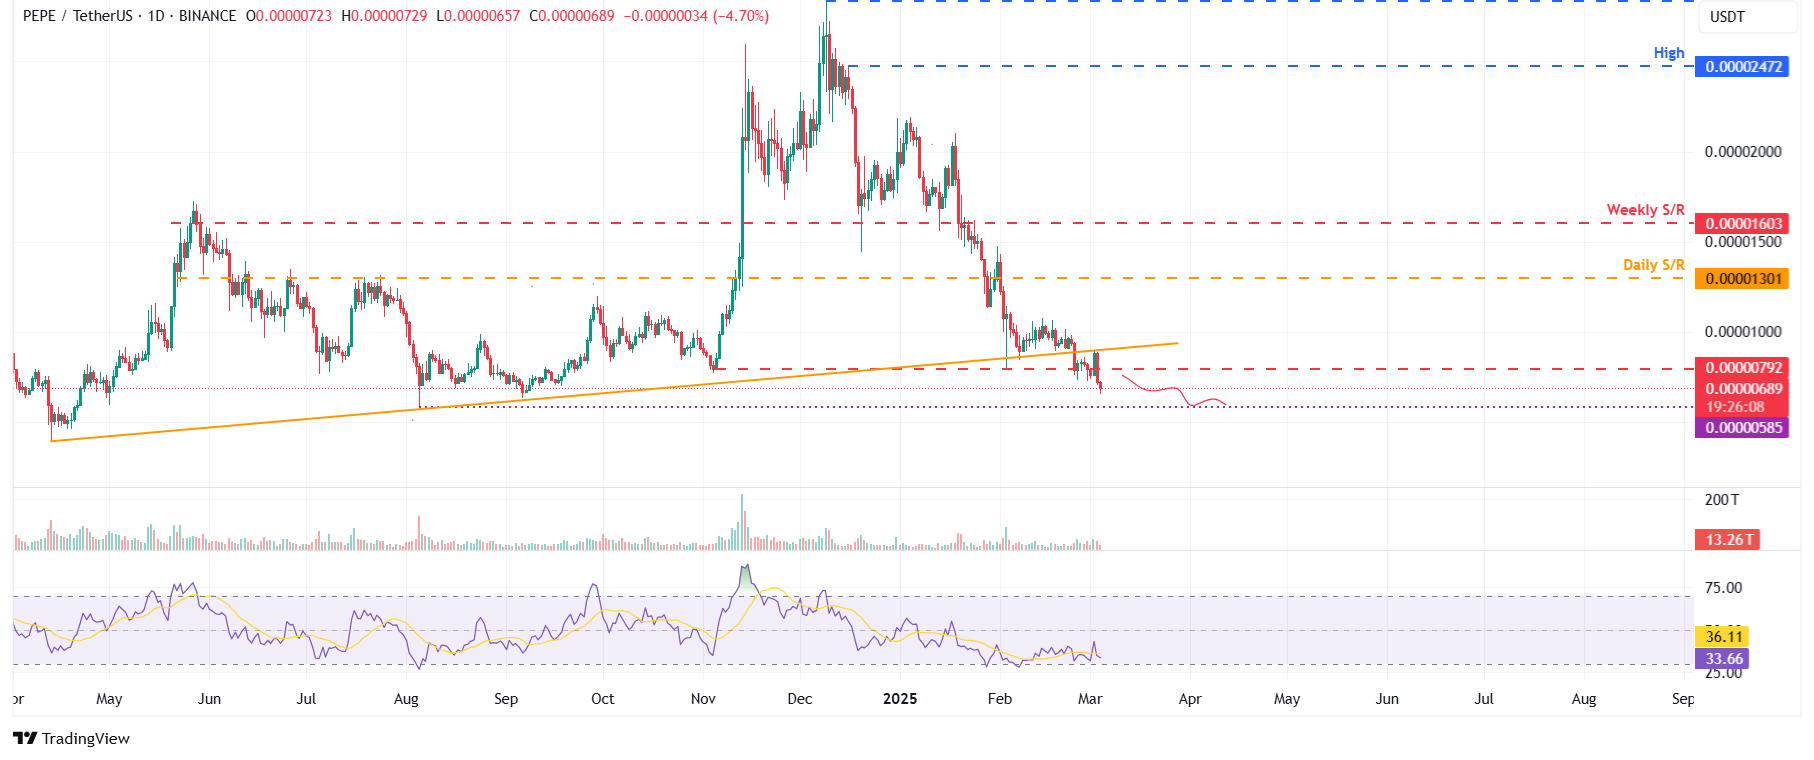
PEPE/USDT daily chart
Santiment’s Daily Active Addresses index, which tracks network activity over time, also paints a bearish picture for the frog-based meme coin. A rise in the metric signals greater blockchain usage, while declining addresses point to lower demand for the network.
In PEPE’s case, Daily Active Addresses fell from 7,319 in early Feburary to 3,611 on Tuesday, extending a downtrend that started in mid-November. This indicates that demand for PEPE’s blockchain usage is decreasing, which doesn’t bode well for Pepe's price.
 [10.04.42, 04 Mar, 2025]-638766681002374070.png)
PEPE daily active addresses chart. Source: Santiment
Another aspect bolstering the frog-based meme coin's bearish outlook is a recent decline in traders’ interest and liquidity in the Pepe memecoin. Santiment data shows that Pepe’s trading volume declined from 3.18 billion in early Feburary to 1.01 billion on Tuesday, extending a downtrend that started in early November.
 [10.43.07, 04 Mar, 2025]-638766681361098316.png)
Pepe volume chart. Source: Santiment
บทความแนะนำ


