
Bitcoin Weekly Forecast: BTC bloodbath continues, near 30% down from its ATH
- Bitcoin price continues to decline on Friday falling over 15% so far this week.
- The total crypto market lost $660 billion in market capitalization and saw $3.68 billion in liquidations this week.
- US Bitcoin spot ETF data recorded a total net outflow of $2.48 billion until Thursday.
Bitcoin (BTC) price extends its decline and trades below $80,000 at the time of writing on Friday, falling over 15% so far this week. This price correction wiped $660 billion of market capitalization from the overall crypto market and saw $3.68 billion in total liquidations this week. Moreover, US Bitcoin spot Exchange Traded Funds (ETFs) data supported BTC’s decline as it recorded a total net outflow of $2.48 billion until Thursday, indicating signs of weakness among institutional investors.
Bybit hack fueled Bitcoin’s sell-off
Bitcoin price declined more than 18% this week from Monday’s high of $96,500 to Friday’s low of $78,258, the highest weekly fall in the last three years. BTC has corrected nearly 30% from its all-time high (ATH) of $109,588 marked on January 20.
This headwind in Bitcoin price was fueled by last week’s news that the Bybit cryptocurrency exchange was compromised, and funds worth $1.4 billion were stolen. The Bybit hack was twice the second largest crypto hack in history, which was PolyNetwork’s $611 million hack in August 2021. The hack eroded market confidence and erased $660 billion of market capitalization from the overall crypto market since the hack, as shown in the graph below.
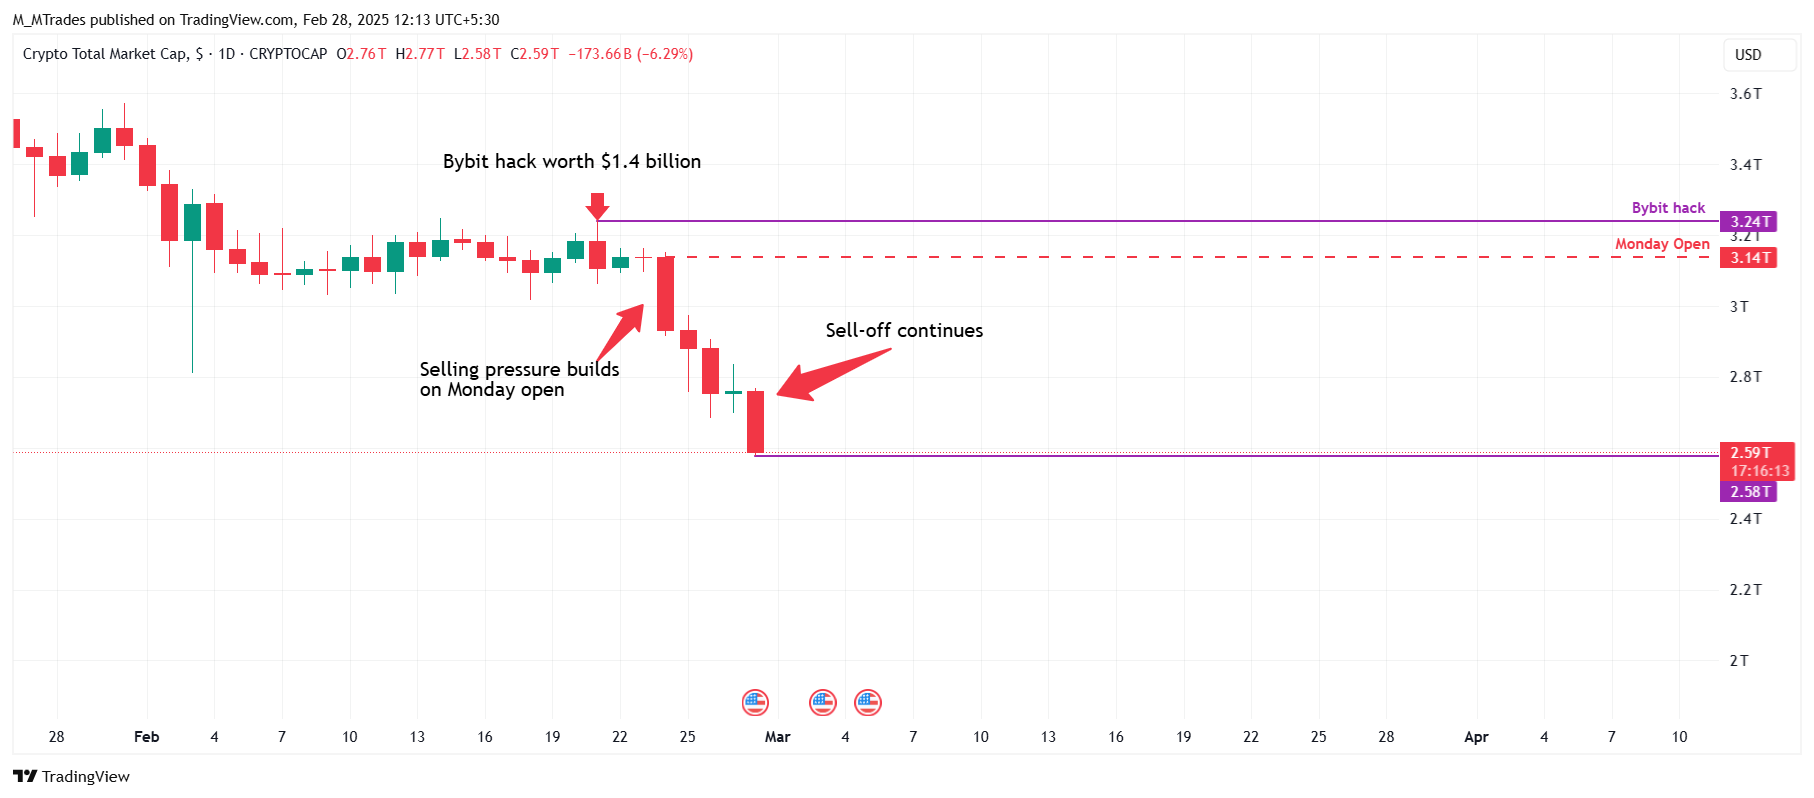
Crypto total market capitalization chart
Moreover, this compromise caused Bybit to lose around $2 billion in BTC from its reserve, according to CryptoQuant data.
A total of 20,190 BTC has been drained from Bybit’s reserve from Friday to Tuesday, reaching reverse levels seen in early March 2024. This was mostly because the exchange did not stop withdrawals after the ETH hack, and investors tend to withdraw funds given the uncertainty in the market.
-638763353308849217.webp)
Bitcoin Exchange Reserve Bybit chart. Source: CryptoQuant
Crypto Fear and Greed Index hits three-year low as leverage traders got liquidated
The Crypto Fear and Greed Index — a metric that measures the overall sentiment of the cryptocurrency market — dropped to nearly a three-year low this week. The index scored 10 on Thursday, indicating a shift in investor sentiment toward extreme fear, as shown in the graph below.
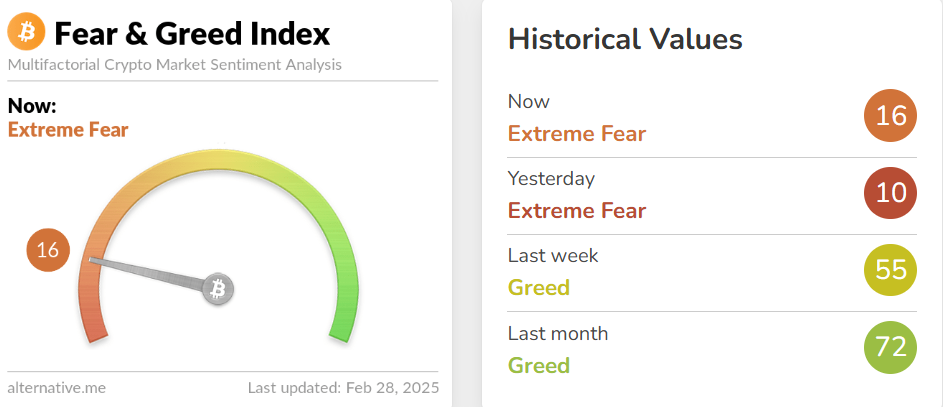
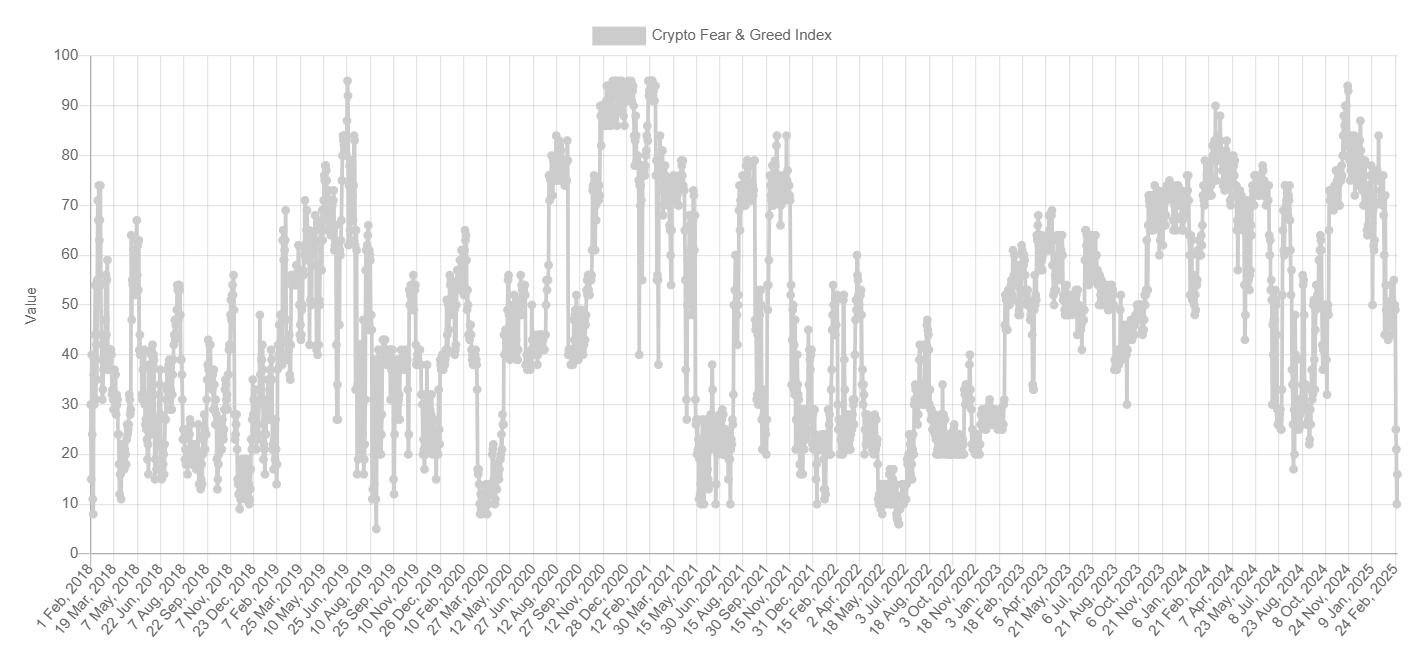
Bitcoin Fear & Greed Index chart. Source: Alternative
In an exclusive interview, Anton Chashchin, Founder & CEO of N7 Capital, told FXStreet, “Seeing Bitcoin’s relative strength compared to altcoins, this correction could be significant for those seeking quick profits.”
Chashchin continued, “If short-term investors face losses, they are unlikely to hold their positions for long. The talk of a “global market freeze” is exaggerated. Political developments remain positive for crypto growth. The Fear and Greed Index currently stands at 10 (Extreme Fear), which suggests a potential market reversal may be imminent.”
A K33 Research report this week explained that Bitcoin correction and volatility were amplified by offshore perpetual futures traders attempting to buy the dip with leverage.
The report continued that the Perps have traded at discounts to the spot for several weeks, but this discount narrowed amidst the open interest spike. Further, funding rates on Binance reached neutral terrain as leverage climbed, pointing toward traders entering longs with leverage. The market quickly punished this behavior, with long liquidations amplifying the move lower. The willingness to buy the dip with leverage is an unfortunate observation in a market facing multiple signs of dampened demand impulses.
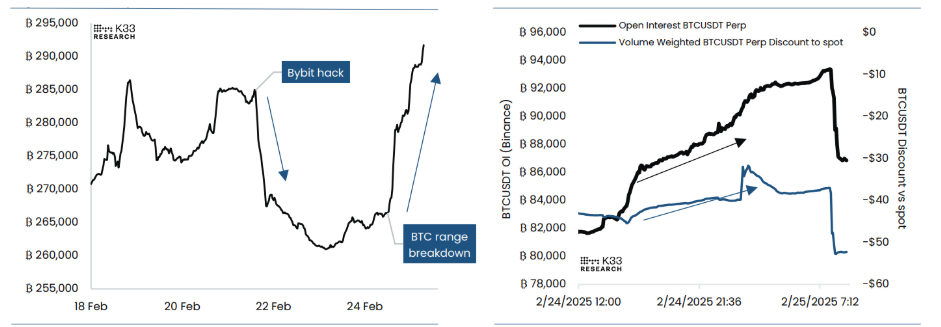
BTC Perps: Notional OI chart (Left) and BTC/USDT Perp OI vs. Discount to spot chart (Right) Source: K33 Research
This downtrend triggered a series of liquidations in the crypto market totaling $3.68 billion from Monday to Friday and $1.75 billion in BTC alone, according to Coinglass data.
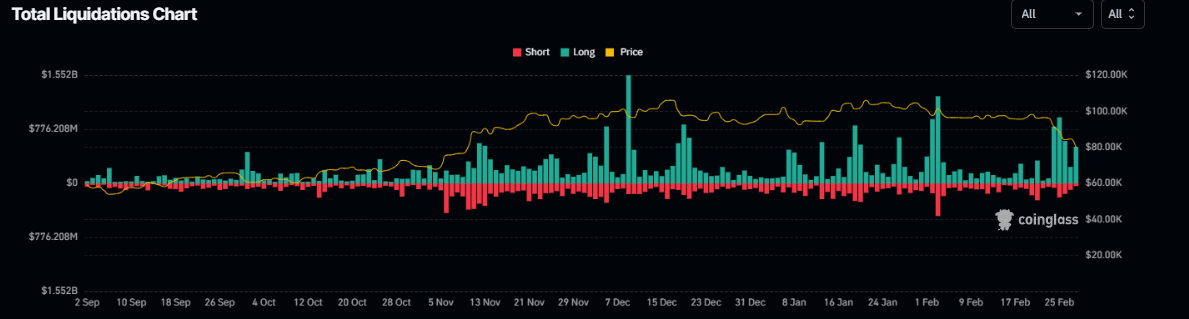
Total Liquidation chart. Source: Coinglass
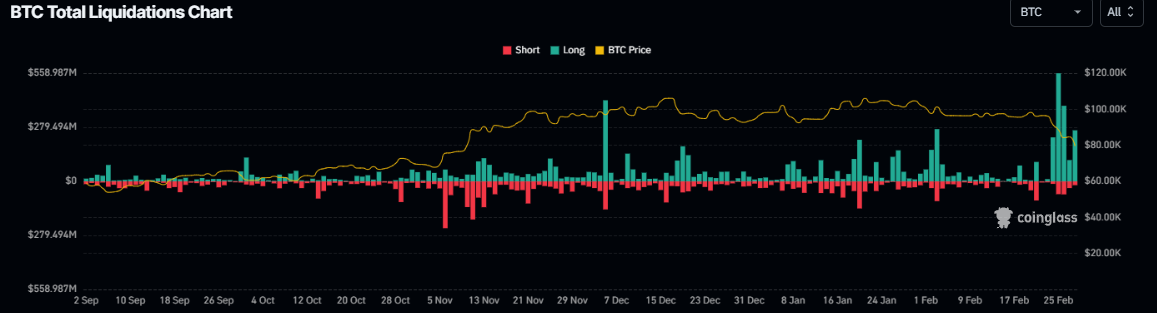
BTC total liquidation chart. Source: Coinglass
Fading institutional investors’ demand for Bitcoin
This week’s falling institutional demand and rising selling pressure supported the Bitcoin price drop. According to Coinglass data, Bitcoin spot Exchange Traded Funds (ETF) data recorded net outflows of $2.48 billion until Thursday, continuing its ongoing sell-off from over the past weeks. If the magnitude of the outflow continues and intensifies, the Bitcoin price could see further corrections.
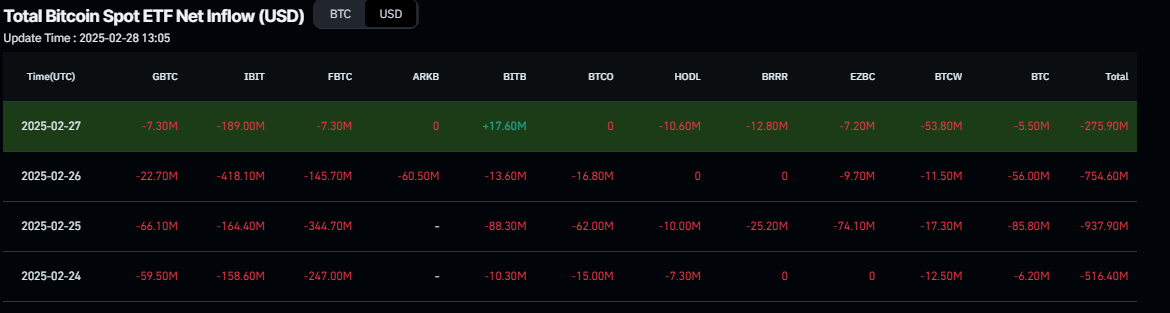
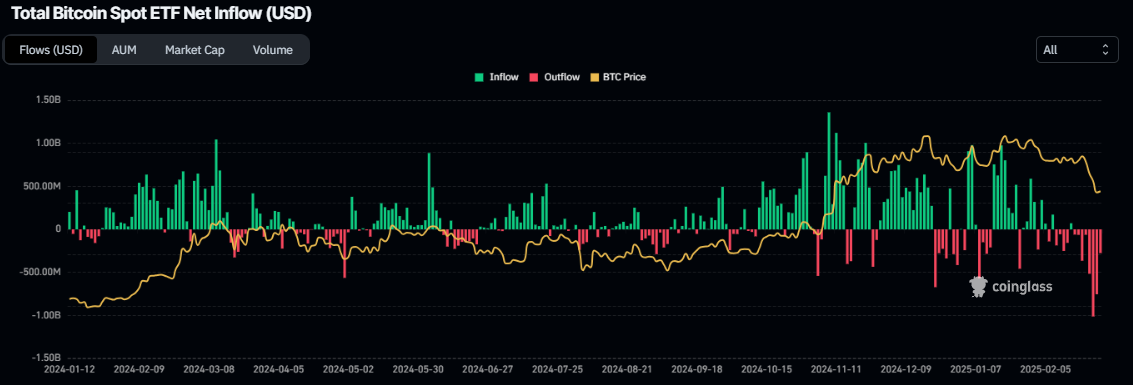
Total Bitcoin spot ETF net inflow chart. Source: Coinglass
In an exclusive interview, Agne Linge, Head of Growth at WeFi, told FXStreet, “Institutional investors appear to be offloading significant Bitcoin holdings, signaling a potential shift in market sentiment.”
Linge continued, “According to Arkham Intelligence, that major players — including Fidelity, Ark, Grayscale, and BlackRock — executed notable BTC sell-offs Thursday. BlackRock transferred 5,100 BTC to Coinbase within the last hour, with a potential plan to sell them, indicating an imminent $400 million liquidation. This wave of institutional selling suggests growing caution, likely in response to macroeconomic factors or short-term profit-taking, which could exert downward pressure on Bitcoin’s price in the near term.”
Macroeconomics data and tariffs hit BTC
Bitcoin price downfall was supported by macroeconomic data and US President Donald Trump’s fresh tariff headlines.
President Trump reiterated his insistence on 25% tariffs on Canada and Mexico, confirming that they will go into effect on March 4. Trump also added the European Union (EU) to the mixed list of countries from which he would penalize US consumers for importing. The US President confirmed that a 25% tariff would be imposed on Europe “on autos and other things” and the “details on EU tariffs coming soon.”
QCP’s Capital report on Wednesday highlights that a global risk-off move has sent equities, Gold, and BTC lower “with whispers of stagflation gaining traction on the street.”
The report continued that the soft data suggests tariffs already weigh on consumer sentiment, as reflected in the Consumer Confidence Index miss (98 vs. 103 expected). Meanwhile, short-term inflation expectations remain elevated across consumer surveys.
The analyst states, “While it’s too early to confirm a stagflationary trajectory, the market’s reaction to recent developments signals growing unease.”
The analyst further explains that the US tariffs have further dampened sentiment and expectations of tougher actions against China, and investors are reducing risk exposure amid heightened uncertainty. Limited marginal buyers could be seen for risk assets in this environment, increasing the likelihood of further downside as crowded trades unwind.
Will Bitcoin sell-off continue?
Bitcoin price broke out of its prolonged consolidation phase seen since early February, slipping below the $94,000 support level and closing at $91,552 after a 4.89% decline on Monday. BTC continued its correction and closed below its $85,000 support level on Wednesday. At the time of writing on Friday, it continues its sell-off, trading at around $79,500.
If BTC continues its correction, it could extend the decline to test its next support level at $73,000.
The daily chart’s Relative Strength Index (RSI) indicator reads 20, pointing downwards within oversold conditions. This indicates significant selling pressure, but technically, it may be due to a potential reversal or bounce. However, traders should be cautious as the RSI may remain below oversold levels and continue correcting.
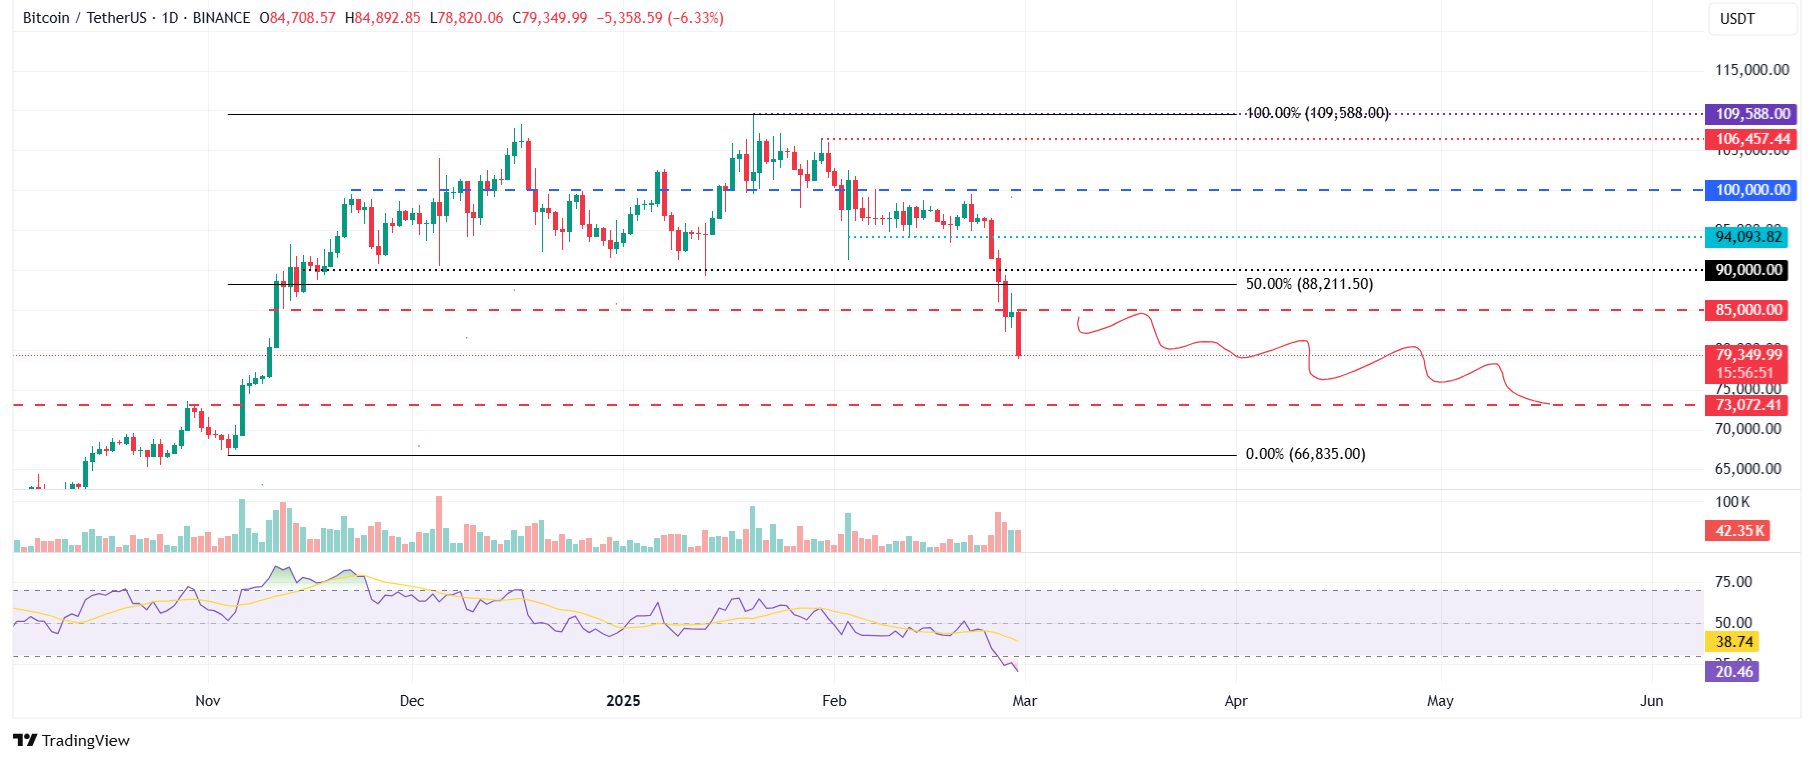
BTC/USDT daily chart
If BTC recovers, it could extend the recovery to retest the $85,000 resistance level.
Bitcoin, altcoins, stablecoins FAQs
Bitcoin is the largest cryptocurrency by market capitalization, a virtual currency designed to serve as money. This form of payment cannot be controlled by any one person, group, or entity, which eliminates the need for third-party participation during financial transactions.
Altcoins are any cryptocurrency apart from Bitcoin, but some also regard Ethereum as a non-altcoin because it is from these two cryptocurrencies that forking happens. If this is true, then Litecoin is the first altcoin, forked from the Bitcoin protocol and, therefore, an “improved” version of it.
Stablecoins are cryptocurrencies designed to have a stable price, with their value backed by a reserve of the asset it represents. To achieve this, the value of any one stablecoin is pegged to a commodity or financial instrument, such as the US Dollar (USD), with its supply regulated by an algorithm or demand. The main goal of stablecoins is to provide an on/off-ramp for investors willing to trade and invest in cryptocurrencies. Stablecoins also allow investors to store value since cryptocurrencies, in general, are subject to volatility.
Bitcoin dominance is the ratio of Bitcoin's market capitalization to the total market capitalization of all cryptocurrencies combined. It provides a clear picture of Bitcoin’s interest among investors. A high BTC dominance typically happens before and during a bull run, in which investors resort to investing in relatively stable and high market capitalization cryptocurrency like Bitcoin. A drop in BTC dominance usually means that investors are moving their capital and/or profits to altcoins in a quest for higher returns, which usually triggers an explosion of altcoin rallies.
บทความแนะนำ


