
Cardano Price Forecast: ADA set for 20% rally as bullish bets increase
- Cardano price extends its rally on Monday after gaining more than 13% last week.
- On-chain metrics suggest a bullish picture as ADA’s long-to-short ratio reached its highest in over a month.
- The technical outlook and funding rates data suggest a rally continuation, targeting 20% additional gains.
Cardano (ADA) price extends its rally on Monday after gaining more than 13% last week. On-chain metrics suggest a bullish picture as ADA’s long-to-short ratio reached the highest level in over a month. The technical outlook and funding rates data suggest a rally continuation, targeting 20% additional gains.
Cardano bulls aim for 20% gains
Cardano price found support around its 61.8% Fibonacci retracement level (drawn from the August 5 low of $0.27 to the December 3 high of $1.32) at $0.67 last week. It rose 13.21%, closing above the weekly resistance level of $0.74. At the start of this week on Monday, it continued to rally by 4.7%, trading at around $0.80.
If the weekly level at $0.74 holds as support, it could extend the rally by 22% from its current levels to retest its January 30 high of $0.98.
The Relative Strength Index (RSI) on the weekly chart reads 53, bouncing off from its neutral level of 50 last week and indicating a maintenance of bullish momentum.
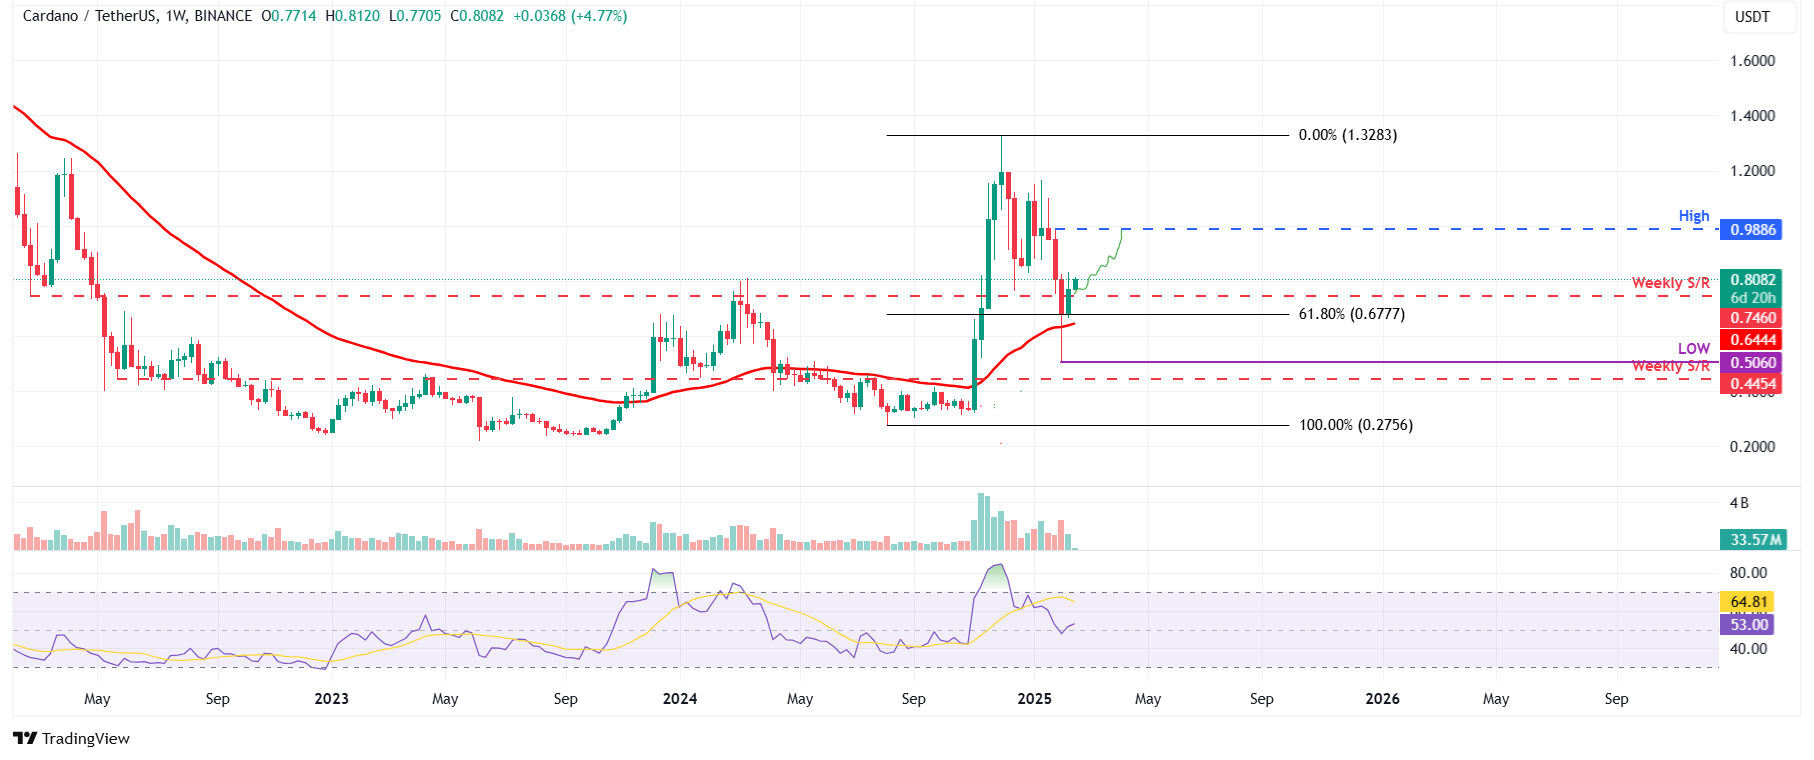
ADA/USDT weekly chart
Another bullish sign is Coinglass’ ADA long-to-short ratio, which reads 1.09, the highest level in over a month. This ratio above one reflects bullish sentiment in the markets as more traders are betting for the asset price to rise.
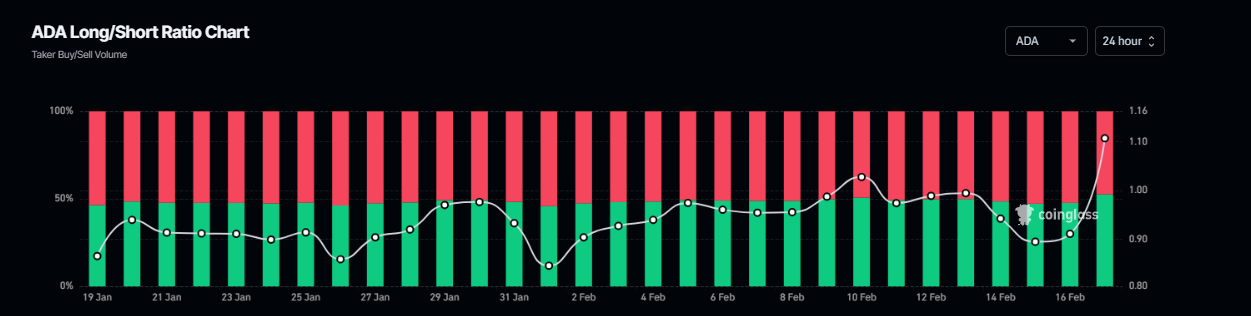
ADA long-to-short ratio chart. Source: Coinglass
According to Coinglass’s OI-Weighted Funding Rate data, the number of traders betting that the price of ADA will slide further is fewer than that anticipating a price increase.
This index is based on the yields of futures contracts, which are weighted by their open interest rates. Generally, a positive rate (longs pay shorts) indicates bullish sentiment, while negative numbers (shorts pay longs) indicate bearishness.
In the case of ADA, the metric increased from -0.0007% on Sunday to 0.0016% on Monday, reflecting a positive rate and indicating that longs are paying shorts. This scenario often signifies bullish sentiment in the market, suggesting potential upward pressure on Cardano’s price.
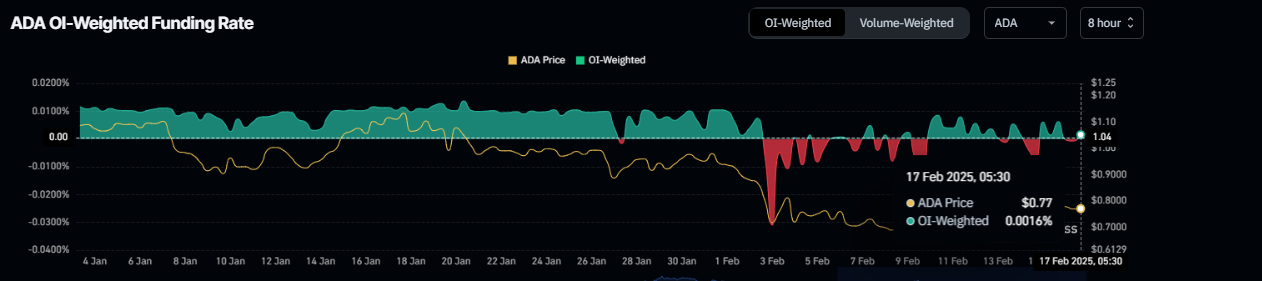
ADA OI-Weighted Funding Rata chart. Source: Coinglass
บทความแนะนำ


