


Bitcoin Price Forecast: BTC hovers around $97,000 as crypto czar David Sacks evaluates US Bitcoin Reserve
- Bitcoin price hovers around $97,000 on Wednesday after falling 3.5% the previous day.
- President Trump’s crypto czar David Sacks says they will evaluate a Bitcoin Reserve.
- A K33 report highlights that Bitcoin CME traders maintain a defensive position and suggest investors avoid leverage at any cost.
Bitcoin (BTC) price hovers around $97,000 on Wednesday after falling 3.5% the previous day. BTC still shows signs of weakness, despite Trump’s crypto czar, David Sacks, announcing during the digital asset press conference that they would evaluate a Bitcoin Reserve. Moreover, the K33 report highlights that Bitcoin CME traders maintain a defensive position and suggests investors avoid leverage at any cost in February.
Bitcoin fails to hold $100,000 mark despite Trump’s administration’s to evaluate BTC Reserve
Bitcoin price faced a pullback in the early Asian trading session, reaching a low of $91,231, but quickly recovered its fall to close above $101,300 on Monday. However, BTC failed to hold the $100,000 mark despite Trump’s administration’s support for digital assets, declining 3.52% on Tuesday.
During the same period, President Trump’s crypto czar, David Sacks, announced during the digital asset press conference that they would evaluate a Bitcoin Reserve. The press conference announced several frameworks and regulatory support for digital assets and stablecoins. At the time of writing on Wednesday, BTC hovers around $97,000.
BREAKING: President Trump's Crypto Czar David Sacks says they're going to evaluate a Bitcoin Reserve. pic.twitter.com/cbQYwcONQC
— Bitcoin Magazine (@BitcoinMagazine) February 4, 2025
Bitcoin CME traders maintain defensive position — K33 Report
A K33 “Ahead of the curve” report on Tuesday highlighted that BTC CME premiums remained soft throughout the week. According to the report, the BTC Open Interest (OI) declined further to sit at 166,475 BTC as of Monday’s close, the lowest CME OI recorded since November 5.
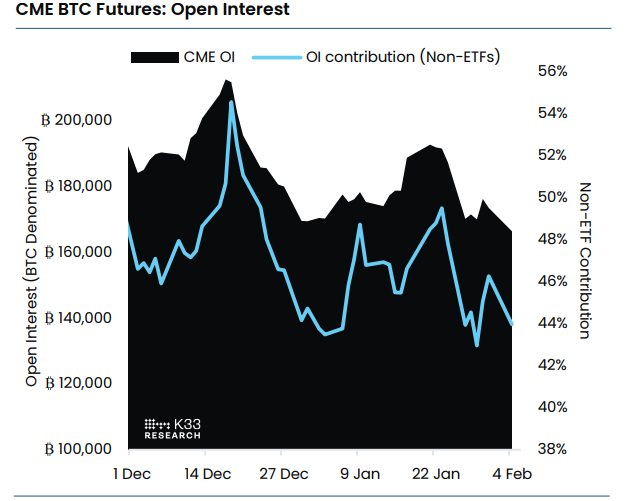
CME BTC Futures Open Interest chart. Source: K33 Research
The graph below suggests that following last month’s roll, the term structure also indicates cautious behavior in farther-dated contracts, with daily next-month premiums hovering at 0.8%.
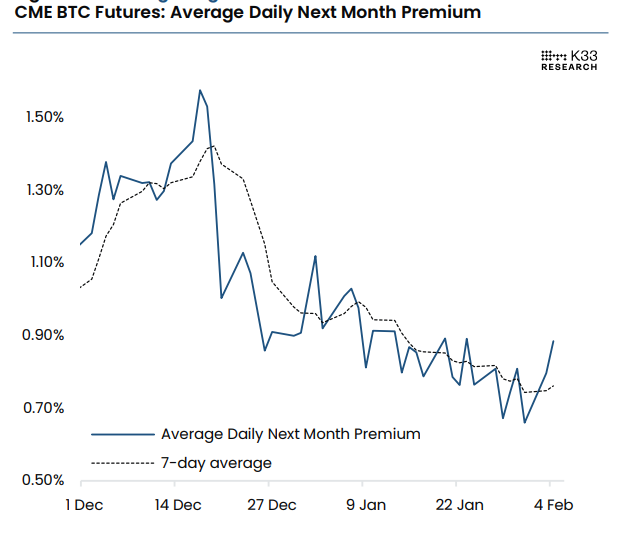
CME BTC Futures average daily next month premium chart. Source: K33 Research
The report states, “February mantra should be to avoid leverage at any cost.” As uncertainty and volatility escalate amid Trump’s favorable crypto regulations, a Bitcoin reserve may begin to take shape, yet market turmoil persists due to tariffs and broader economic instability.
Moreover, Bitcoin could expect volatility due to FTX’s upcoming repayments to creditors starting on February 18. The bankrupt exchange is set to begin repayment to creditors with claims under $50,000, particularly those in the Bahamas, with 9% interest per annum from November 11, 2022.
The exchange first filed for bankruptcy in November 2022 with an estimated debt of $11.2 billion. Payouts are expected to total up to $16.5 billion, while the exchange is raising additional funds by selling assets and investments in tech firms. This news is significant as it marks a crucial step in recovery for those affected by the FTX collapse in November 2022, generating considerable interest in the cryptocurrency community.
FTX Repayments: 18 Feb 2025
— Sunil (FTX Creditor Champion) (@sunil_trades) February 4, 2025
Funds available from 10am ET
FTX Claims < $50k
FTX Creditors in the Bahamas process have email confirmation that repayments will start on 18 Feb 2025
9% interest per annum from 11 Nov 2022 pic.twitter.com/FrmDN4qiK7
Bitcoin Price Forecast: BTC bears aim for $90,000 level
Bitcoin price faced a pullback in the early Asian trading session, reaching a low of $91,231, but quickly recovered from its fall to close above $101,300 on Monday. However, it failed to maintain its recovery and declined 3.52% on Tuesday. At the time of writing on Wednesday, it hovers around $97,500.
If BTC continues its correction, it could extend the decline to test its psychologically important level of $90,000.
The Relative Strength Index (RSI) on the daily chart reads 43, after being rejected from below its neutral level of 50, and points downwards, indicating strong bearish momentum. Moreover, the Moving Average Convergence Divergence (MACD) showed a bearish crossover on Friday, hinting at further correction ahead.
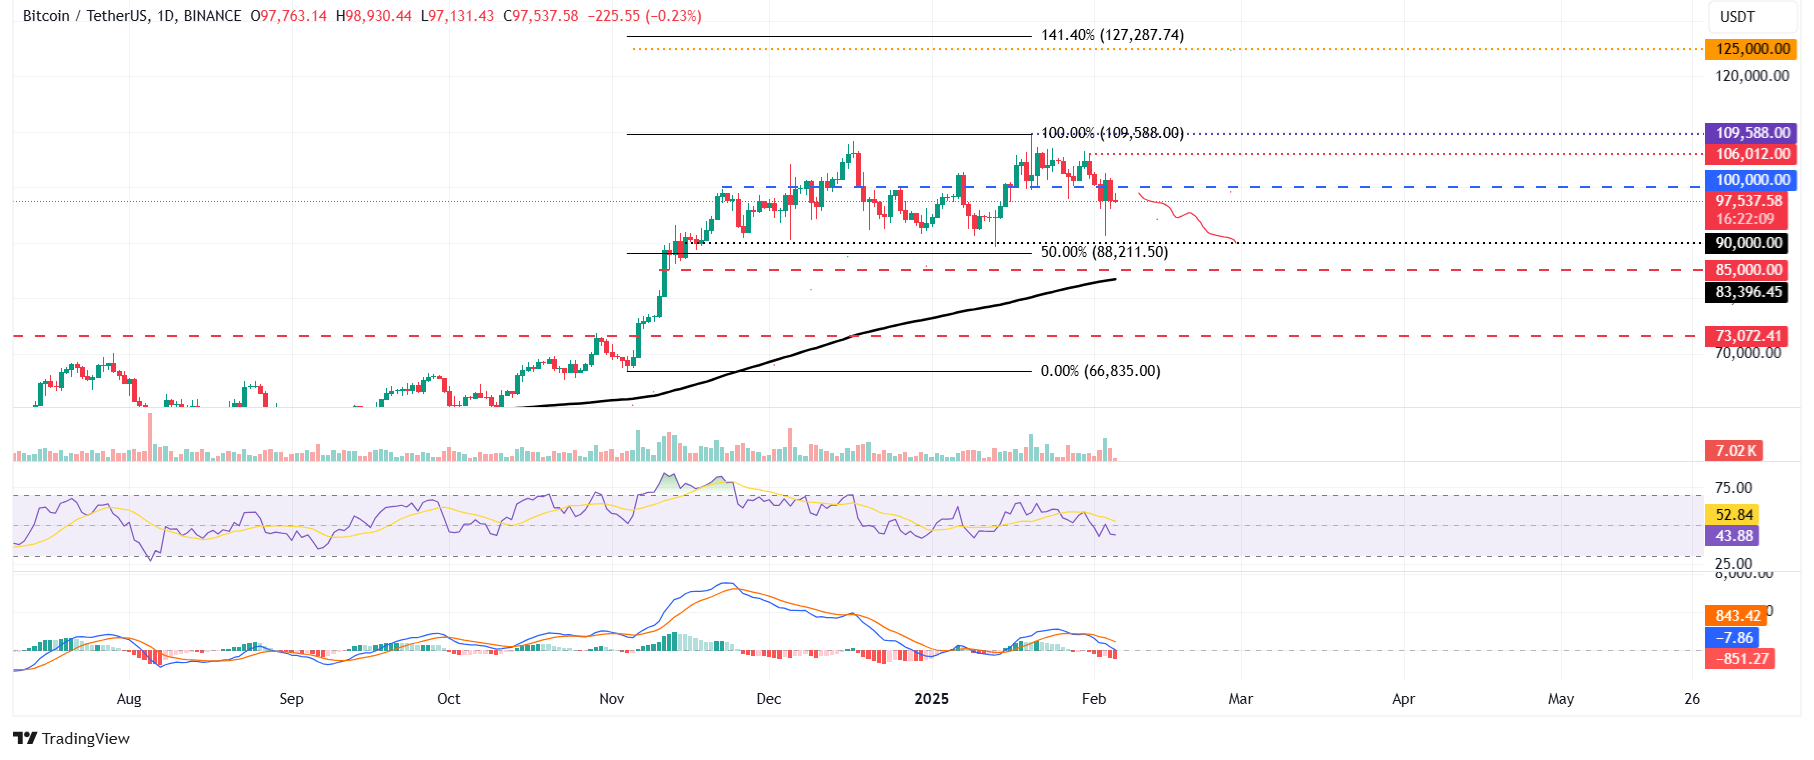
BTC/USDT daily chart
However, if BTC recovers and finds support around $100,000, it would extend the recovery to retest its Friday high of $106,012.
Bitcoin, altcoins, stablecoins FAQs
Bitcoin is the largest cryptocurrency by market capitalization, a virtual currency designed to serve as money. This form of payment cannot be controlled by any one person, group, or entity, which eliminates the need for third-party participation during financial transactions.
Altcoins are any cryptocurrency apart from Bitcoin, but some also regard Ethereum as a non-altcoin because it is from these two cryptocurrencies that forking happens. If this is true, then Litecoin is the first altcoin, forked from the Bitcoin protocol and, therefore, an “improved” version of it.
Stablecoins are cryptocurrencies designed to have a stable price, with their value backed by a reserve of the asset it represents. To achieve this, the value of any one stablecoin is pegged to a commodity or financial instrument, such as the US Dollar (USD), with its supply regulated by an algorithm or demand. The main goal of stablecoins is to provide an on/off-ramp for investors willing to trade and invest in cryptocurrencies. Stablecoins also allow investors to store value since cryptocurrencies, in general, are subject to volatility.
Bitcoin dominance is the ratio of Bitcoin's market capitalization to the total market capitalization of all cryptocurrencies combined. It provides a clear picture of Bitcoin’s interest among investors. A high BTC dominance typically happens before and during a bull run, in which investors resort to investing in relatively stable and high market capitalization cryptocurrency like Bitcoin. A drop in BTC dominance usually means that investors are moving their capital and/or profits to altcoins in a quest for higher returns, which usually triggers an explosion of altcoin rallies.
บทความแนะนำ


