Altcoins Tron and Toncoin Price Prediction: TRX and TON show signs of weakness

แหล่งที่มา Fxstreet
  • Tron and Toncoin prices extend the decline on Thursday after falling more than 6% this week.
  • TRX and TON face rejection from key levels, suggesting double-digit cash ahead.
  • Traders should be cautious as both altcoins show signs of weakness in momentum indicators.

Tron (TRX) and Toncoin (TON) prices extend their decline on Thursday after falling more than 6% this week. TRX and TON prices faced rejection from key levels, suggesting double-digit cash ahead. Furthermore, the technical outlook also supports a bearish trend as both altcoins show signs of weakness in momentum indicators.

Tron Price Forecast: Poised for a double-digit crash

Tron price faced rejection at the 61.8% Fibonacci retracement on Tuesday (drawn from the November 7 low of $0.159 to the December 4 high of $0.450) at $0.270 and declined 6.67% until Wednesday. At the time of writing on Thursday, it trades down around $0.244, below its 50-day Exponential Moving Average (EMA) support level of $0.248.

If TRX closes below the 50-day EMA at $0.248, it could extend the decline by 16.8% to test its December 2 low of $0.203.

The Relative Strength Index (RSI) reads 42, below its neutral level of 50, and points downwards, indicating strong bearish momentum. Additionally, the Moving Average Convergence Divergence (MACD) indicator also shows a bearish crossover on Tuesday, suggesting a sell signal and a downtrend. 
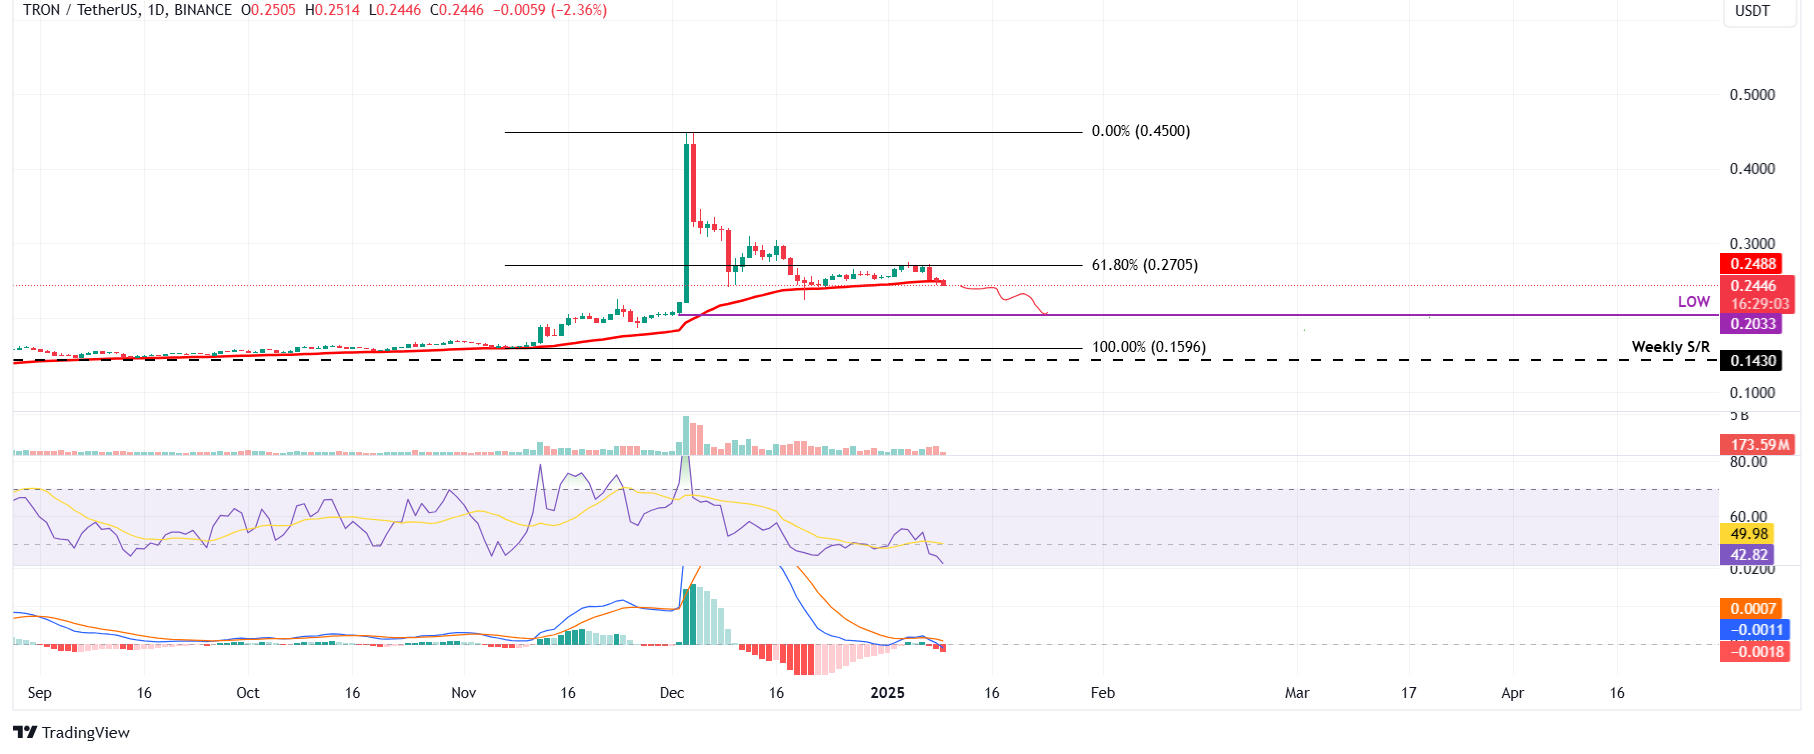
TRX/USDT daily chart

TRX/USDT daily chart

Toncoin price action shows signs of bearish momentum 

Toncoin price was rejected from the 50-day EMA level of $5.72 on Tuesday and declined by 7% until Wednesday. At the time of writing on Thursday, it continues to edge down, trading around $5.20.

If TON continues its downward trend, it could extend the decline by 11.5% from its current level to retest its next daily support at $4.60.

Like TRX, Tron’s RSI indicator trades below its neutral level of 50 and points downwards, indicating strong bearish momentum. Moreover, the MACD shows a bearish crossover on Tuesday. 
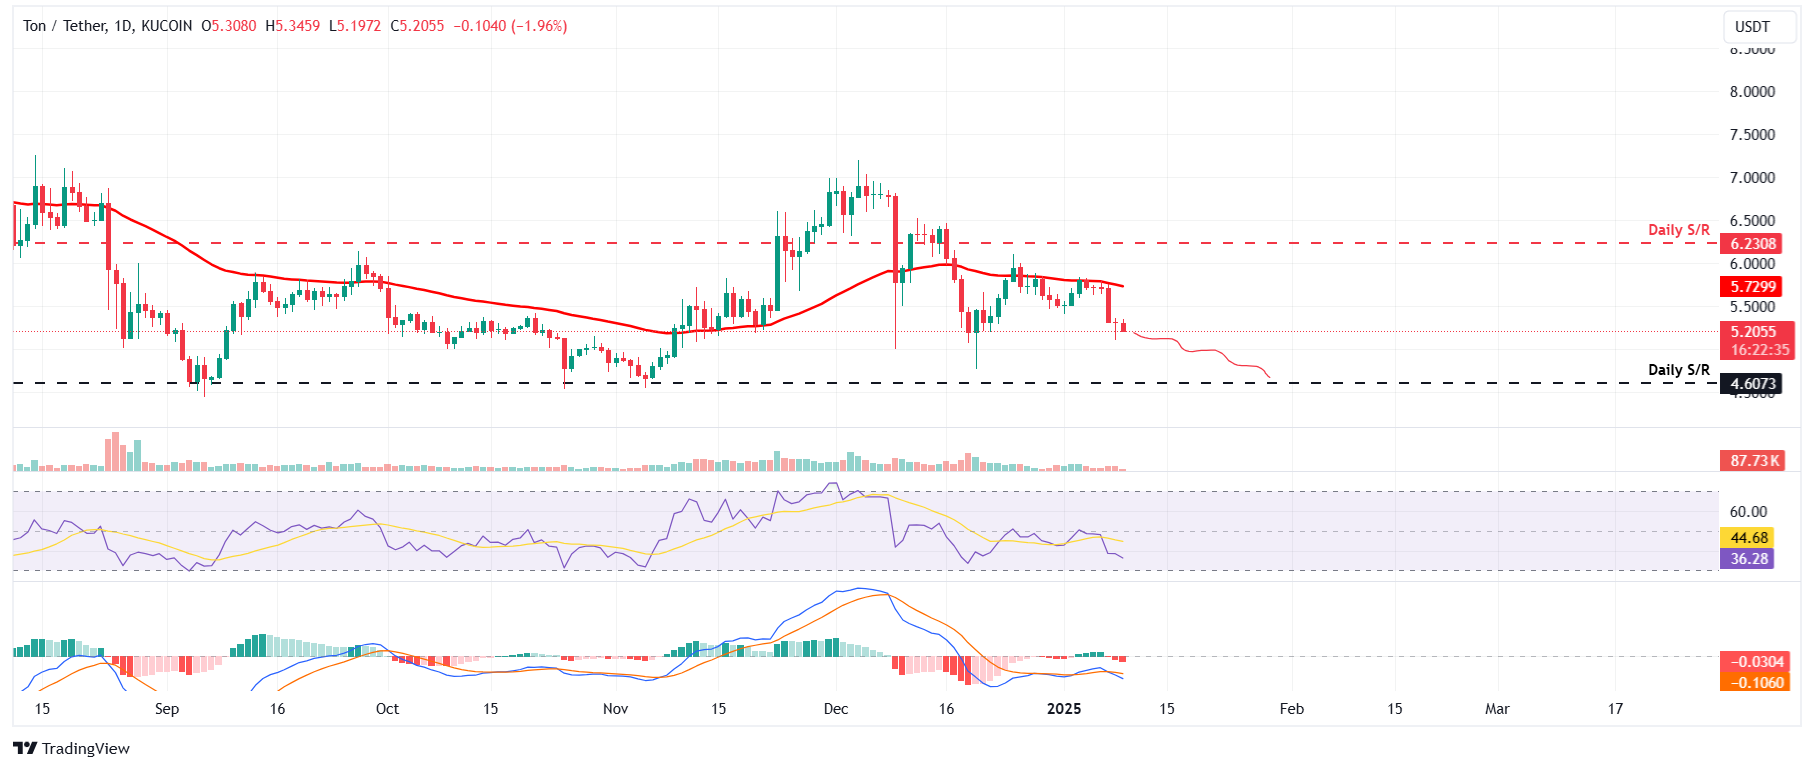
TON/USDT daily chart

TON/USDT daily chart

ข้อจำกัดความรับผิดชอบ: เพื่อการอ้างอิงเท่านั้น ผลการดำเนินงานในอดีตไม่ได้บ่งบอกถึงผลลัพธ์ในอนาคต
placeholder
EUR/USD สูญเสียโมเมนตัมใกล้ระดับ 1.0300 ก่อนการเปิดเผยยอดค้าปลีกของยูโรโซนในช่วงเช้าของตลาดลงทุนยุโรปวันพฤหัสบดี คู่ EURUSD เคลื่อนไหวในแดนลบเป็นวันที่สามติดต่อกันมาที่บริเวณ 1.0310
ผู้เขียน  FXStreet
13 ชั่วโมงที่แล้ว
ในช่วงเช้าของตลาดลงทุนยุโรปวันพฤหัสบดี คู่ EURUSD เคลื่อนไหวในแดนลบเป็นวันที่สามติดต่อกันมาที่บริเวณ 1.0310
placeholder
หุ้น AMD ลดลง 5% จากอันดับเครดิตที่ลดลงของนักวิเคราะห์Advanced Micro Devices (AMD) ถูกลดระดับจาก "ซื้อ" เป็น "ลด" และราคาเป้าหมายก็ลดลงจาก 200 ดอลลาร์เหลือ 110 ดอลลาร์หรือเกือบครึ่งหนึ่งโดยนักวิเคราะห์ของ HSBC ในวันพุธ หุ้น AMD ร่วง 5% เนื่องจากการปรับลด HSBC นักวิเคราะห์กล่าวว่าการตรวจสอบล่าสุดมีความจำเป็นเนื่องจากความกังวลเกี่ยวกับความสามารถของบริษัทในการแข่งขัน […]
ผู้เขียน  Cryptopolitan
17 ชั่วโมงที่แล้ว
Advanced Micro Devices (AMD) ถูกลดระดับจาก "ซื้อ" เป็น "ลด" และราคาเป้าหมายก็ลดลงจาก 200 ดอลลาร์เหลือ 110 ดอลลาร์หรือเกือบครึ่งหนึ่งโดยนักวิเคราะห์ของ HSBC ในวันพุธ หุ้น AMD ร่วง 5% เนื่องจากการปรับลด HSBC นักวิเคราะห์กล่าวว่าการตรวจสอบล่าสุดมีความจำเป็นเนื่องจากความกังวลเกี่ยวกับความสามารถของบริษัทในการแข่งขัน […]
placeholder
AUD/JPY เคลื่อนไหวใกล้ 98.50 หลังจากข้อมูลเงินเฟ้อรายเดือนของออสเตรเลียในช่วงเช้าของตลาดลงทุนเอเชียวันพุธ AUD/JPY ฟื้นตัวจากการขาดทุนรายวันเล็กน้อย โดยมีการเคลื่อนไหวอยู่ที่ประมาณ 98.40
ผู้เขียน  FXStreet
เมื่อวาน 03: 43
ในช่วงเช้าของตลาดลงทุนเอเชียวันพุธ AUD/JPY ฟื้นตัวจากการขาดทุนรายวันเล็กน้อย โดยมีการเคลื่อนไหวอยู่ที่ประมาณ 98.40
placeholder
WTI ปรับตัวขึ้นเหนือระดับ $74.00 จากการลดลงของน้ำมันดิบคงคลังในสหรัฐฯ ที่มากขึ้น และความหวังต่อความต้องการของจีนWest Texas Intermediate (WTI) ซึ่งเป็นเกณฑ์ราคามาตรฐานของน้ำมันดิบสหรัฐฯ ซื้อขายอยู่ที่ประมาณ 74.15 ดอลลาร์ในวันพุธ
ผู้เขียน  FXStreet
เมื่อวาน 02: 07
West Texas Intermediate (WTI) ซึ่งเป็นเกณฑ์ราคามาตรฐานของน้ำมันดิบสหรัฐฯ ซื้อขายอยู่ที่ประมาณ 74.15 ดอลลาร์ในวันพุธ
placeholder
AUD/USD ขยับขึ้นสู่ระดับ 0.6300 ใกล้กับจุดสูงสุดในรอบสองสัปดาห์ที่ตั้งไว้เมื่อวันจันทร์ในช่วงครึ่งแรกของเซสชั่นยุโรปวันอังคาร คู่ AUD/USD กลับมาเป็นขาขึ้นหลังจากการย่อตัวกลับมาจากระดับ 0.6300 หรือระดับสูงสุดในรอบสองสัปดาห์ของวันก่อนหน้า และยังคงมีการเพิ่มขึ้นระหว่างวันอย่างต่อเนื่อง
ผู้เขียน  FXStreet
1 เดือน 07 วัน อังคาร
ในช่วงครึ่งแรกของเซสชั่นยุโรปวันอังคาร คู่ AUD/USD กลับมาเป็นขาขึ้นหลังจากการย่อตัวกลับมาจากระดับ 0.6300 หรือระดับสูงสุดในรอบสองสัปดาห์ของวันก่อนหน้า และยังคงมีการเพิ่มขึ้นระหว่างวันอย่างต่อเนื่อง
ตราสารที่เกี่ยวข้อง
goTop
quote