Litecoin Price Forecast: 40,000 LTC traders exit as crypto crash triggers $500M in liquidations
- Litecoin trades around $102 on Wednesday after tumbling near 10% in the previous day.
- Crypto markets experience over $500 million liquidations as hotter than expected US JOLTs jobs data triggered hawkish fears.
- LTC funded wallets declined to 8.06 million on Tuesday, with 40,000 traders exiting their positions in the last 3 days.
Litecoin price slid 10% to hit a 7-day low of $102 on Wednesday. On-chain metrics show a large number of LTC holders exiting their positions as hawkish US jobs data sparked downward volatility.
Litecoin price struggling to hold $100 support amid crypto market crash
Litecoin, along with other major cryptocurrencies, faced significant downward pressure in early January 2025.
The broader crypto sell-off was catalyzed by the United States (US) Federal Reserve's (Fed) hawkish signals, reinforced by hotter-than-expected JOLTs jobs data, which amplified expectations of fewer rate cuts in2025.
This hawkish US jobs data has caught bullish traders unaware, sparking over $500 million in liquidations wiped out across the crypto derivatives market.
The bearish market even has promptly pushed Litecoin close to the critical $100 support level.
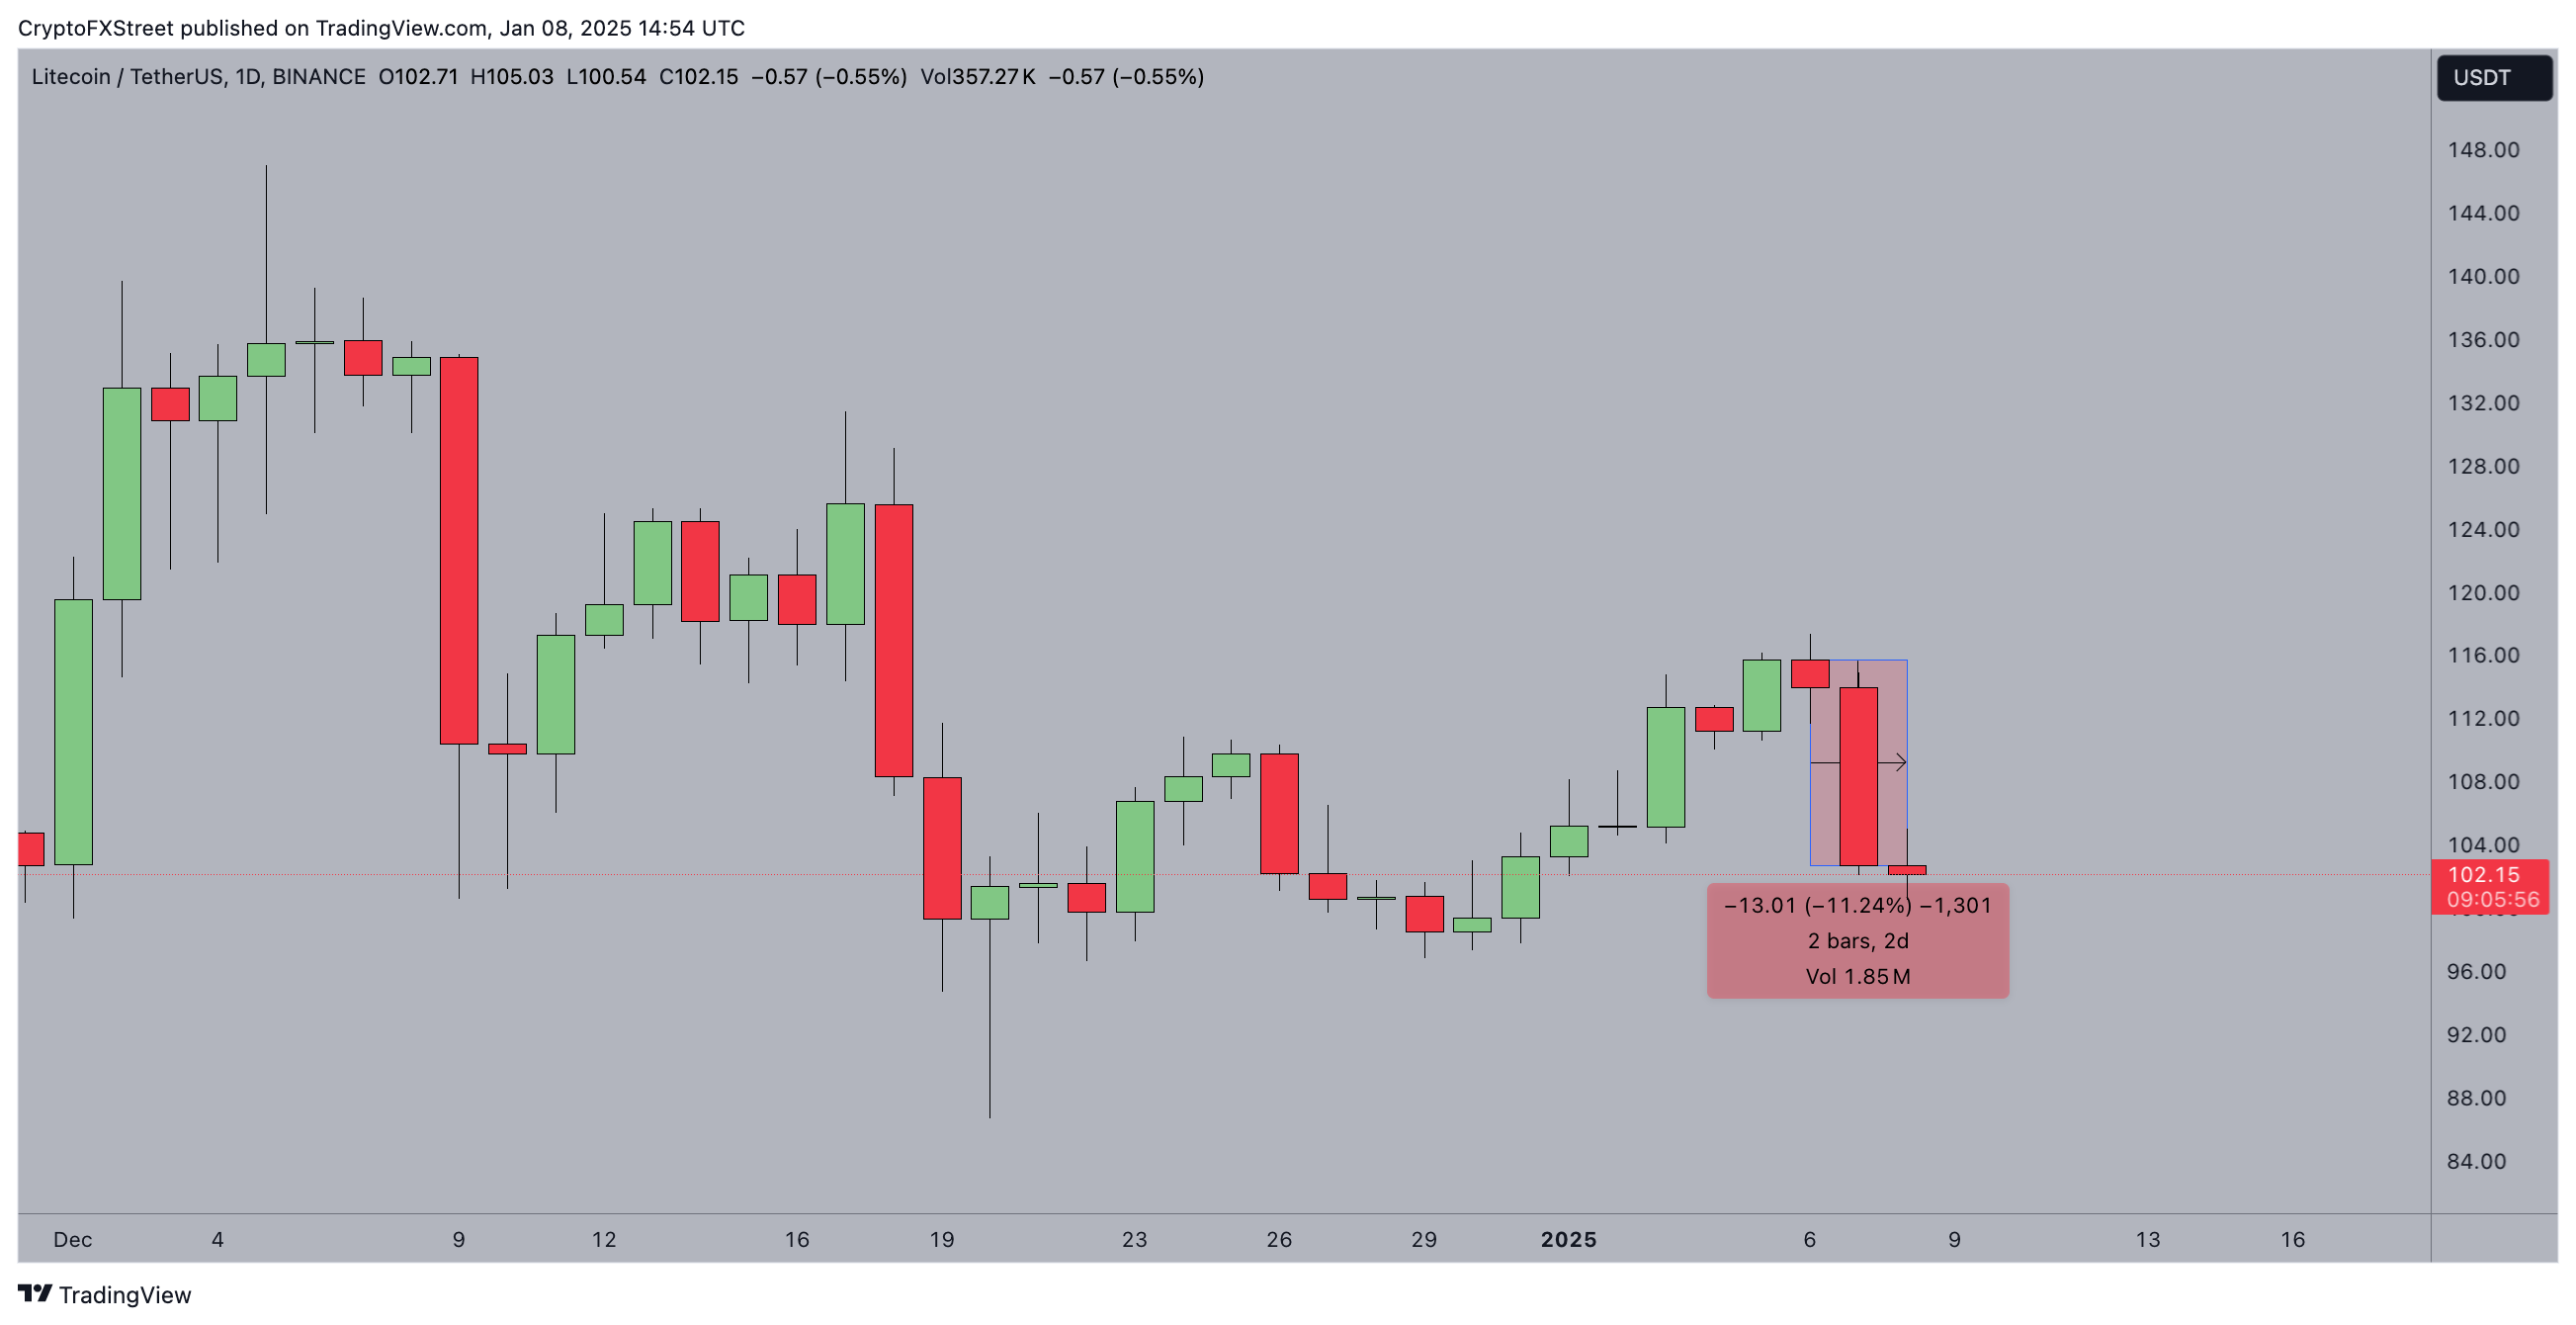
 Litecoin Price Action | LTCUSDT (Binance)
The chart above shows how LTC price slid 11.2% in the last 24 hours, dropping from $113 on Friday to a 7-day low of $102 by Wednesday. This marks a significant pullback after a 20%
Amid macroeconomic uncertainty, losing the $100 support could expose Litecoin’s price to further downside risks.
Traders shut down 40,000 LTC wallets amid macroeconomic uncertainty
While the hawkish US jobs data has dominated media headlines, on-chain data show bearish pressure has been building up within the LTC market for slightly longer.
While price rose 20% in the first 6 days of 2025, a large number of existing LTC holders opted to cash out.
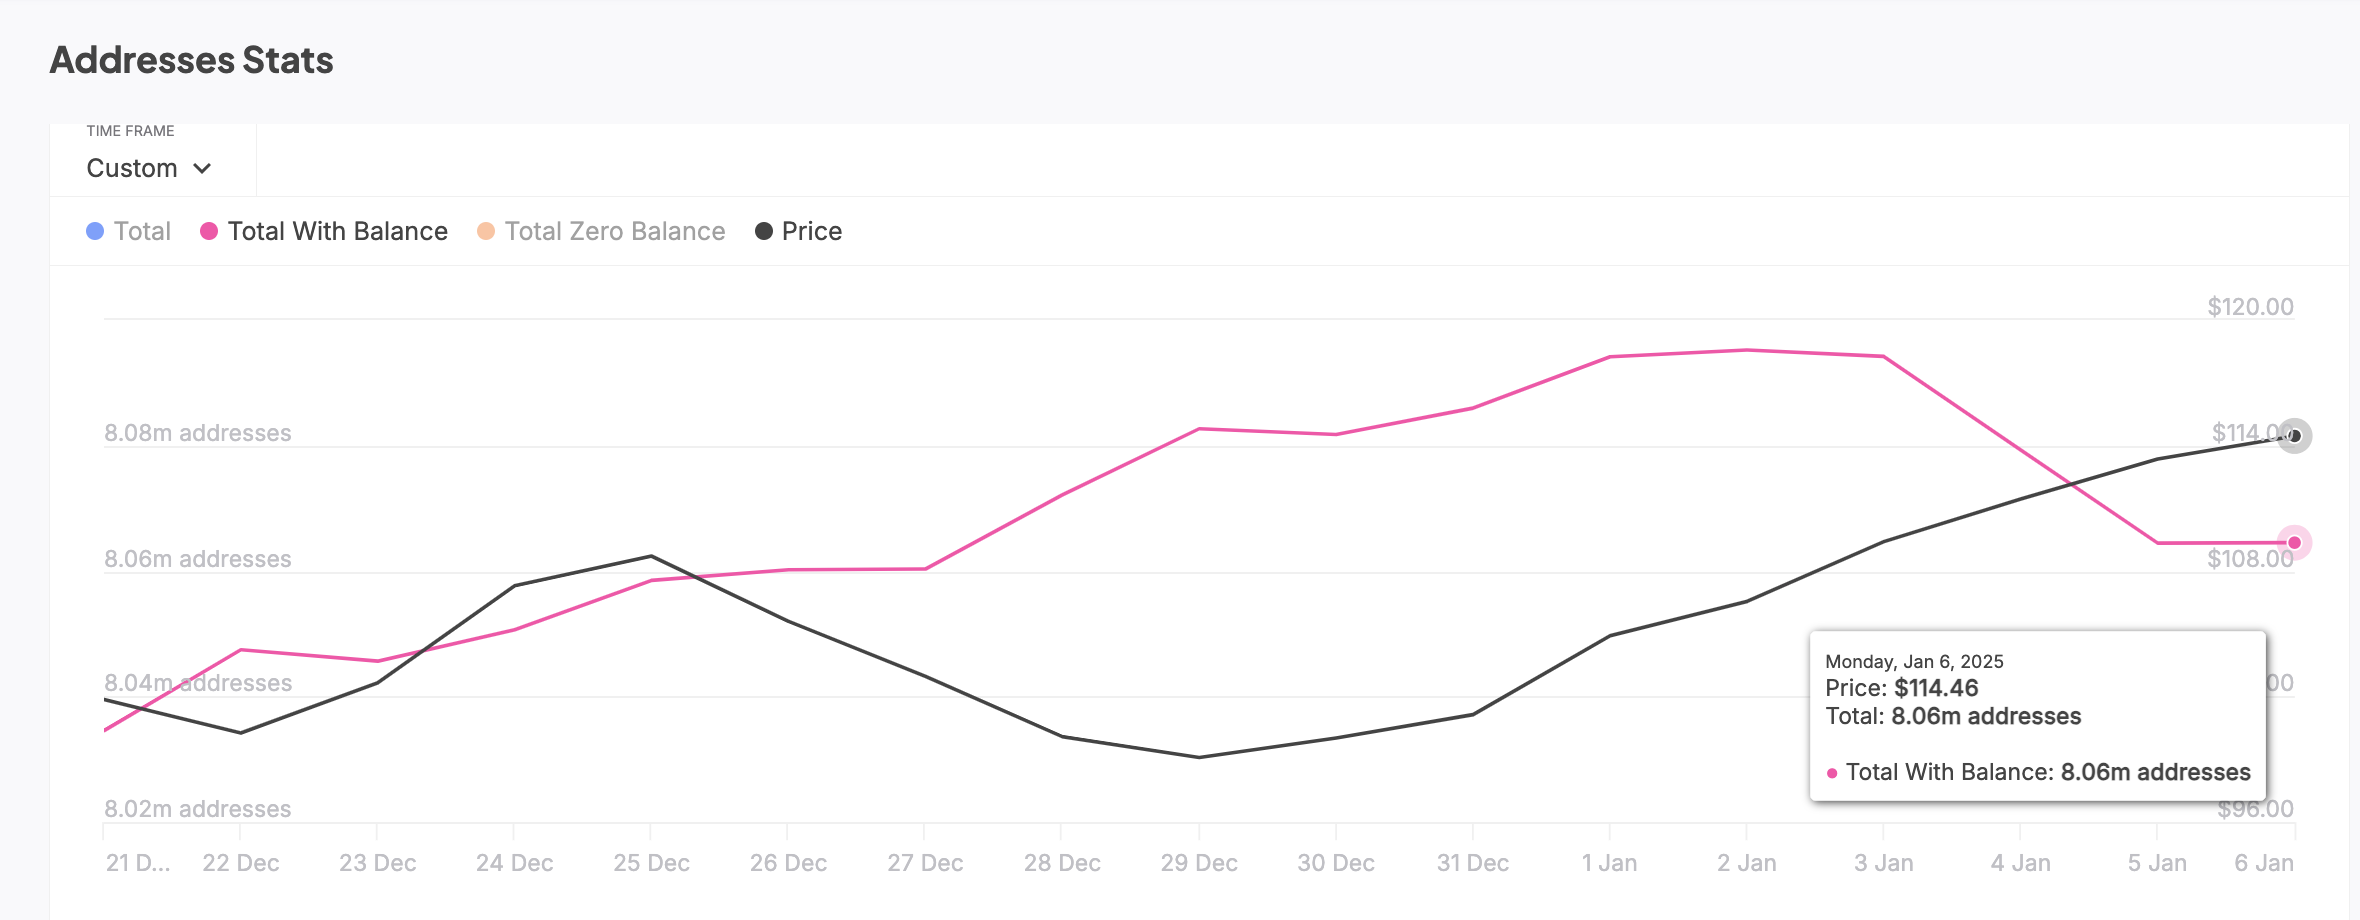
IntoTheBlock’ Total Address chart below tracks the daily changes in the number of funded wallets addressed on the Litecoin blockchain network.
 Litecoin Addresses Stats | January 2025 | Source: On-chain Metrics
Over 8.1 million LTC wallet addresses were active as of January 2.
According to the chart above, the total number of wallets holding Litecoin dropped by 40,000 in the past week, settling at 8.06 million as of Monday.
This decline is indicative of reduced participation and confidence in the asset, compounded by the hawkish stance from the Fed that sparked widespread liquidations across the crypto market.
If bearish sentiment persists, LTC may struggle to hold the $100 support level in the coming trading sessions.
LTC Price Forecast: Holding $100 support could trigger a $120 breakout
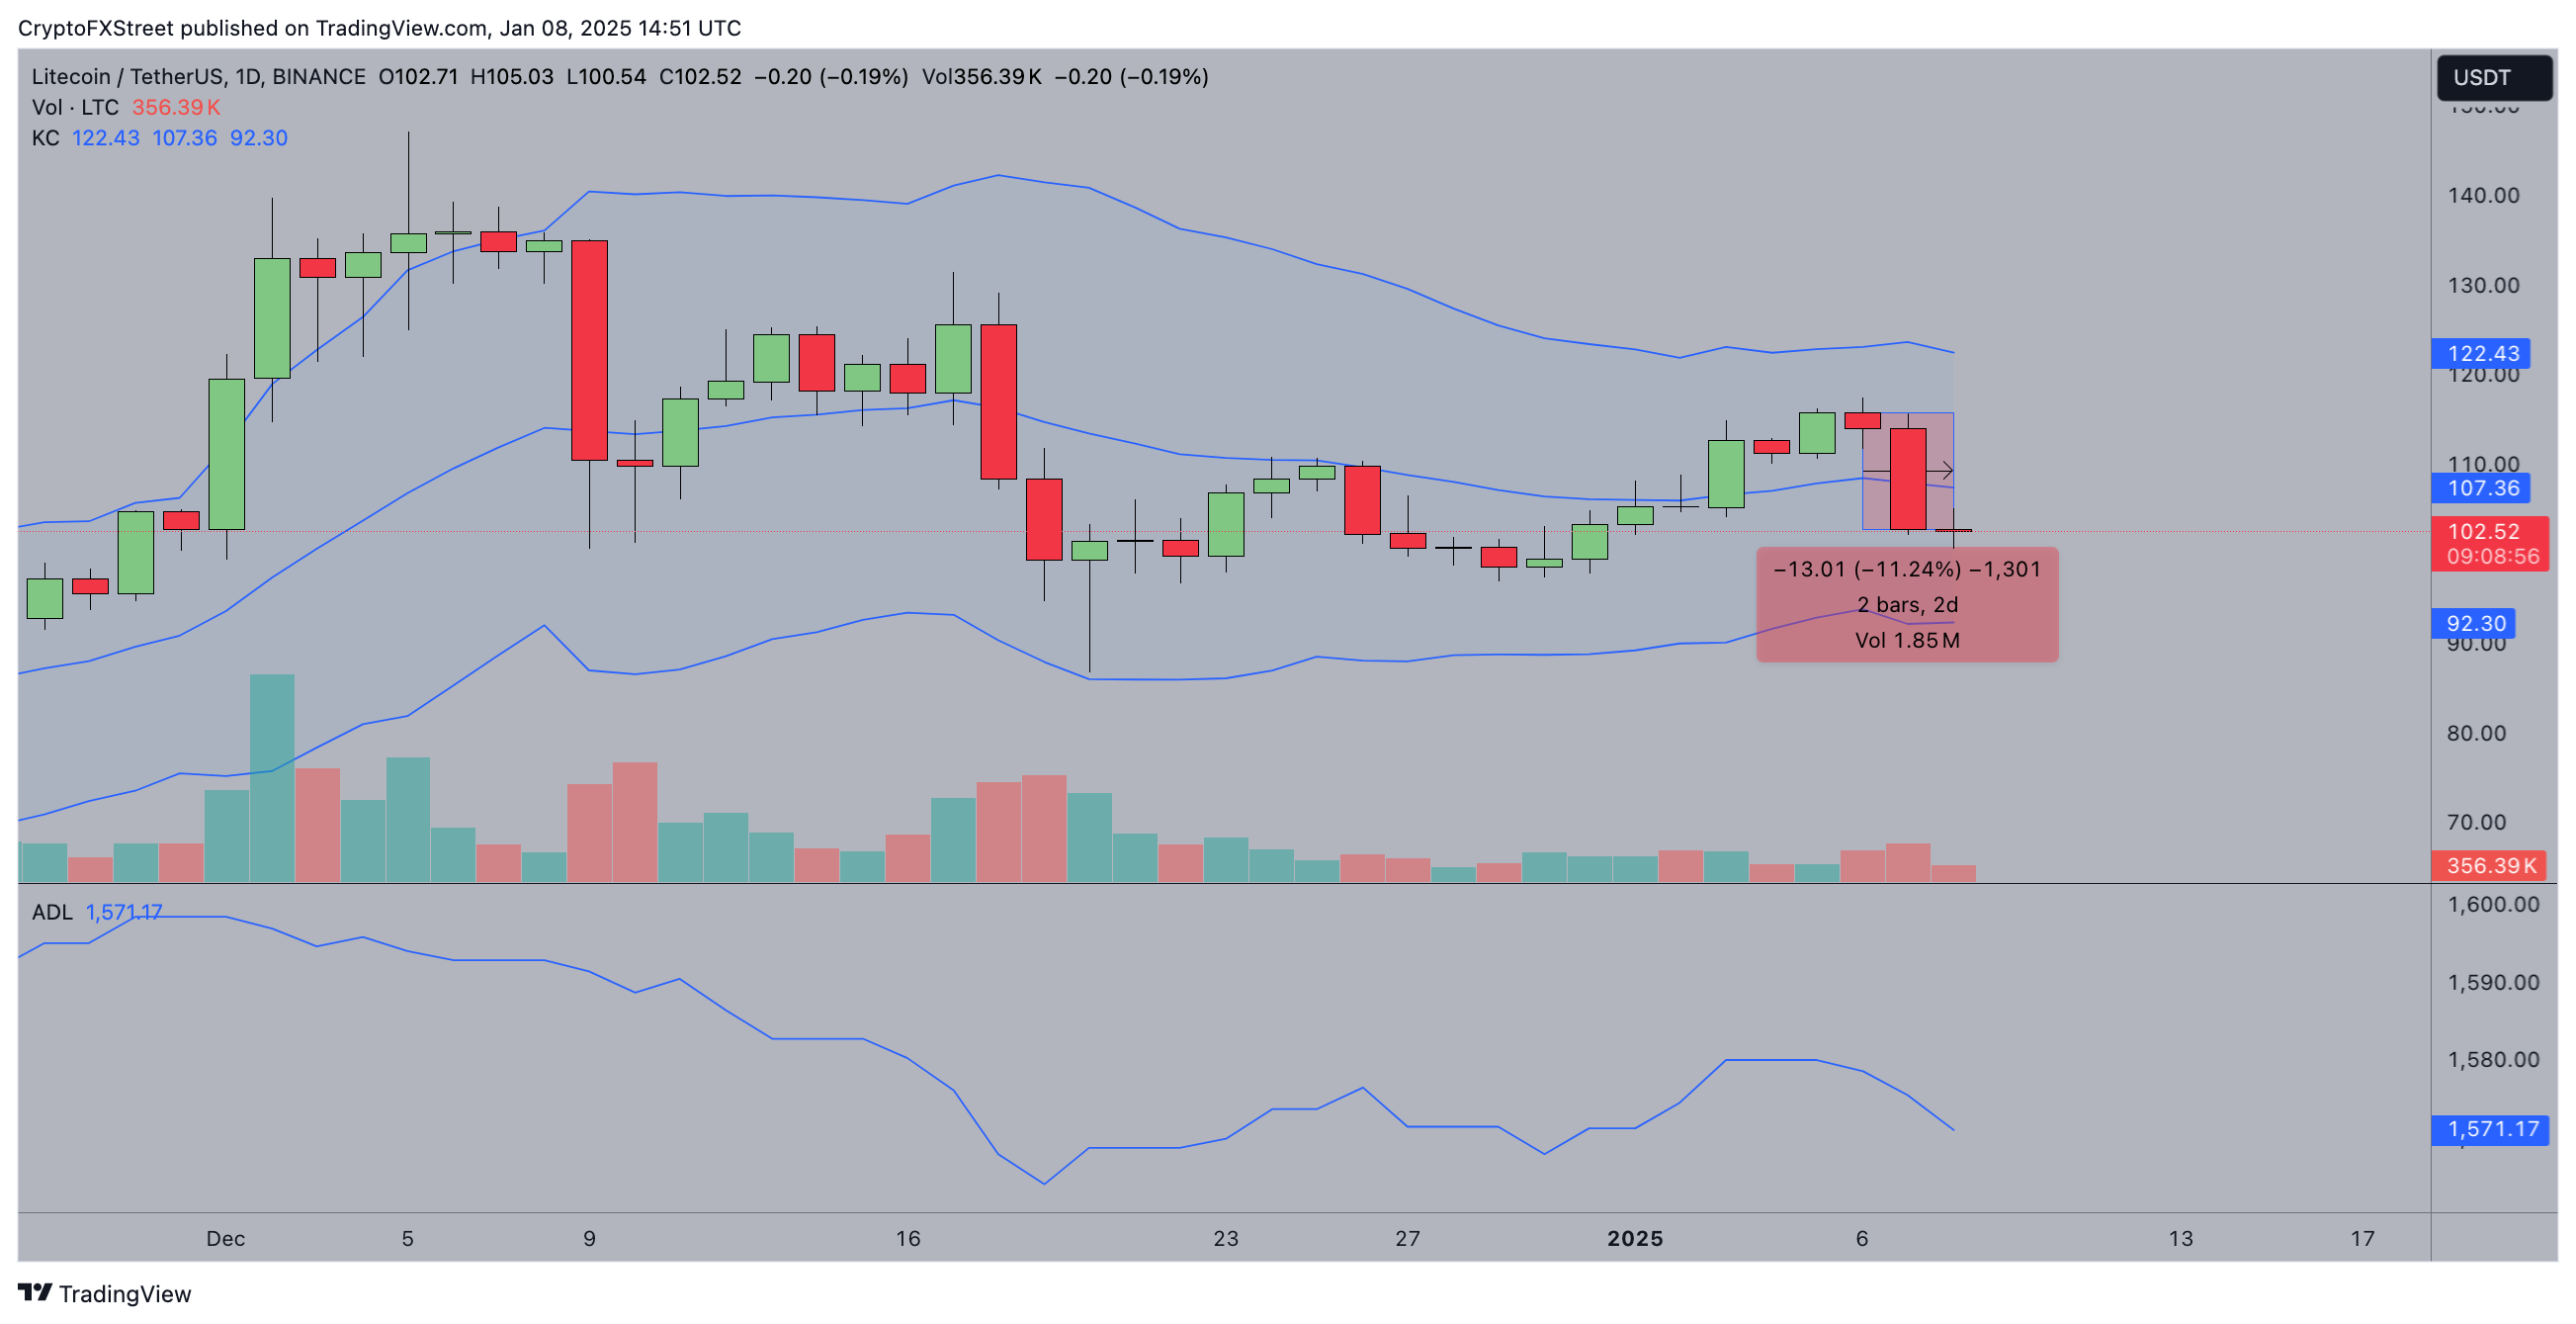
Litecoin (LTC) is trading at $102.52 after a sharp 11.24% decline over the past two days, with the price currently hovering near the critical $100 support level.
Key technical indicators present contrasting scenarios for traders.
The Keltner Channel bands indicate that LTC is consolidating near its lower band of $92.30, suggesting the current sell-off could be nearing exhaustion.
A strong bounce from the $100 support level, coupled with increased buying volume, could propel the price back towards the midline resistance of $107.36.
 Litecoin price forecast (LTCUSD)
A sustained move above this level could set the stage for a retest of $122.43, representing a significant 20% upside potential.
Additionally, the Accumulation/Distribution Line (ADL) holding steady at 1.57 million signals underlying support from longer-term holders, further bolstering bullish prospects.
Conversely, failure to hold the $100 psychological support could trigger another wave of selling pressure, pushing LTC towards the lower Keltner Channel boundary at $92.30.
Bearish momentum may accelerate if volume spikes in tandem with further declines, with a potential downside target of $85.
The shrinking trading volume over the last several sessions adds weight to the bearish case, signaling low demand for LTC at current price levels.

