Solana Price Forecast: SOL looks set to resume rally after recent correction, on-chain data shows

แหล่งที่มา Fxstreet
  • Solana price rebounds after it found support around $205.41 on Tuesday.
  • On-chain data shows signs of recovery as SOL’s daily trading volume rises and the long-to-short ratio reaches the highest level in a month.
  • A daily candlestick close below $205.41 would invalidate the bullish thesis.

Solana (SOL) price recovers on Wednesday, finding support near the $205 level after a sharp pullback earlier in the week. On-chain data hints at a rally in the short term as SOL’s daily trading volume rises and the long-to-short ratio reaches the highest level in a month.

Solana technical outlook, on-chain data hint at recovery 

Solana price reached a new all-time high (ATH) of $264.39 on November 22 and corrected afterward. SOL declined more than 16% in the next 17 days, retesting its 61.80% Fibonacci retracement level at $205.41, which is drawn from its August low of $110 to its ATH.

This level roughly coincides with the 50-day Exponential Moving Average (EMA) at $213.12 andthe daily support level of $213.12, making this area a key reversal zone. At the time of writing on Wednesday, SOL rebounds, trading around $220.

If the $205.41 continues to hold as support, the altcoin could go for another leg higher to retest its December 6 high of $247.

However, the Relative Strength Index (RSI) on the daily chart reads 46, still below its neutral level of 50, suggesting indecisiveness among traders. For the bullish momentum to resume, the RSI should trade above its neutral level. Such a development would add a tailwind to the recovery rally.
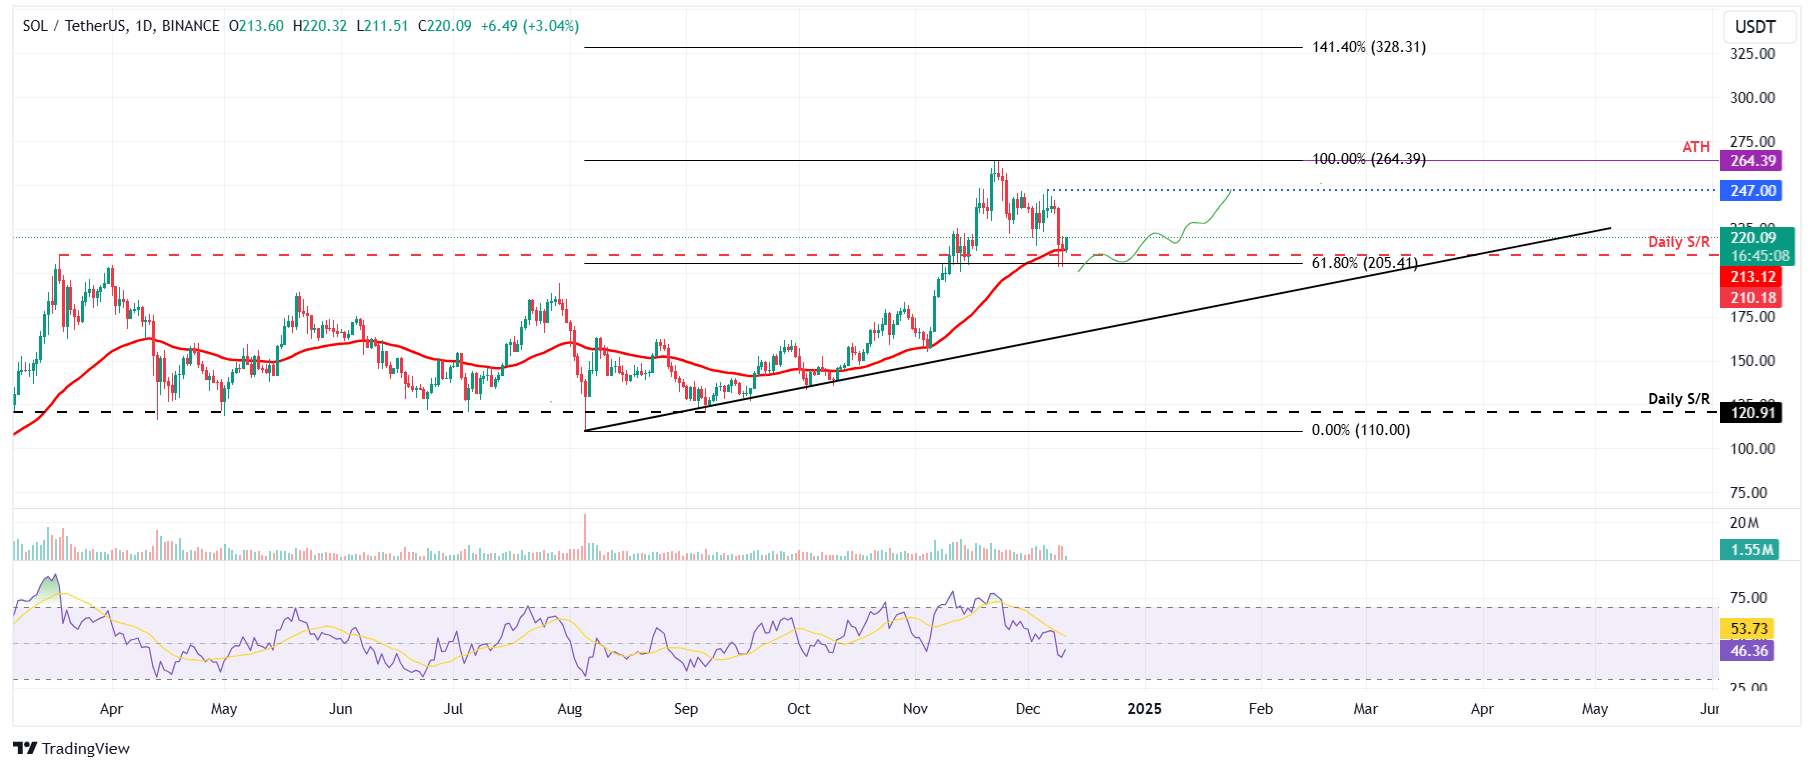
SOL/USDT daily chart

SOL/USDT daily chart

Meanwhile, on-chain metrics for Solana are positive. Crypto intelligence tracker DefiLlama data shows a recent surge in traders’ interest and liquidity in Solana’s chain. The daily trading volume has risen from $2.92 billion on Saturday to $5.99 billion on Wednesday, reaching the highest level since November 20.
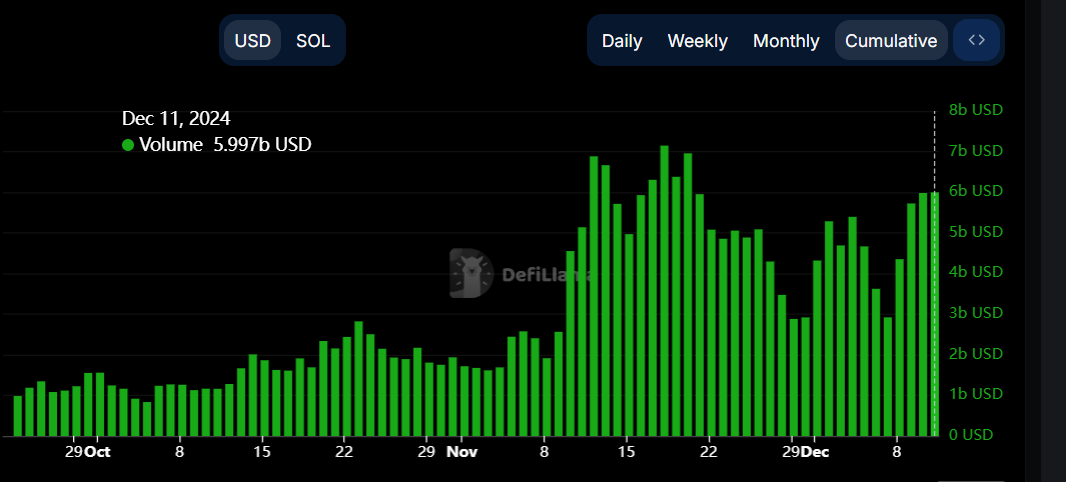
SOL daily trading volume chart. Source: DefiLlama

SOL daily trading volume chart. Source: DefiLlama

Coinglass’s data shows that SOL’s long-to-short ratio stands at 1.03, the highest level in a month. This ratio reflects bullish sentiment in the market, as a figure above one suggests that more traders anticipate the price of the altcoin to rise, bolstering Solana’s bullish outlook.

SOL  long-to-short ratio chart. Source: Coinglass

SOL long-to-short ratio chart. Source: Coinglass

However, if SOL’s daily candlestick closes below the $205.41 support level, the decline will resume to retest its psychologically important level of $200.

ข้อจำกัดความรับผิดชอบ: เพื่อการอ้างอิงเท่านั้น ผลการดำเนินงานในอดีตไม่ได้บ่งบอกถึงผลลัพธ์ในอนาคต
placeholder
การคาดการณ์ราคาหุ้น AAPL: ภายในปี 2566 นี้ จะสามารถกลับคืนสู่มูลค่าตลาด 3 ล้านล้าน ได้หรือไม่?การลดลงของราคาหุ้นของ Apple มีสาเหตุหลักมาจากปัจจัยด้านลบและทัศนคติเชิงลบของนักลงทุนที่มีต่อตลาดโดยรวม คุณค่าที่แท้จริง รวมถึงประสิทธิภาพของผลิตภัณฑ์ และ บริการ Apple จะยังคงเป็นปัจจัยเชิงบวกได้ตลอดทั้งปี 2022 ปัจจัยลบระดับมหภาคที่ส่งผลต่อราคาหุ้น Apple จะค่อยๆ อ่อนตัวลงในปี 2566
ผู้เขียน  Mitrade
วันที่ 08 มิ.ย. 2023
การลดลงของราคาหุ้นของ Apple มีสาเหตุหลักมาจากปัจจัยด้านลบและทัศนคติเชิงลบของนักลงทุนที่มีต่อตลาดโดยรวม คุณค่าที่แท้จริง รวมถึงประสิทธิภาพของผลิตภัณฑ์ และ บริการ Apple จะยังคงเป็นปัจจัยเชิงบวกได้ตลอดทั้งปี 2022 ปัจจัยลบระดับมหภาคที่ส่งผลต่อราคาหุ้น Apple จะค่อยๆ อ่อนตัวลงในปี 2566
placeholder
หุ้น Amazon พุ่งหลังรายได้ Q3 ออกมาดีเกินคาดAmazon.com Inc. (NASDAQ:AMZN) รายงานผลประกอบการในไตรมาส 3 ซึ่งสูงกว่าที่นักวิเคราะห์คาดการณ์ ส่งผลให้หุ้นเพิ่มขึ้น 5.7% ในการซื้อขายหลังปิดตลาด แม้ว่าบริษัทจะประกาศการคาดการณ์ในไตรมาสต่อไปต่ำกว่าที่คา
ผู้เขียน  Investing.com
11 เดือน 01 วัน ศุกร์
Amazon.com Inc. (NASDAQ:AMZN) รายงานผลประกอบการในไตรมาส 3 ซึ่งสูงกว่าที่นักวิเคราะห์คาดการณ์ ส่งผลให้หุ้นเพิ่มขึ้น 5.7% ในการซื้อขายหลังปิดตลาด แม้ว่าบริษัทจะประกาศการคาดการณ์ในไตรมาสต่อไปต่ำกว่าที่คา
placeholder
WTI ยังคงต่ำกว่า $70.00 เนื่องจากข้อมูลจีนที่อ่อนแอทำให้เกิดความกังวลเกี่ยวกับความต้องการWest Texas Intermediate (WTI) ซึ่งเป็นเกณฑ์ราคามาตรฐานของน้ำมันดิบสหรัฐฯ ซื้อขายอยู่ที่ประมาณ 69.70 ดอลลาร์ในวันพุธ
ผู้เขียน  FXStreet
12 เดือน 18 วัน พุธ
West Texas Intermediate (WTI) ซึ่งเป็นเกณฑ์ราคามาตรฐานของน้ำมันดิบสหรัฐฯ ซื้อขายอยู่ที่ประมาณ 69.70 ดอลลาร์ในวันพุธ
placeholder
NZD/USD ลอยตัวต่ำกว่า 0.5650 เนื่องจาก GDP ที่อ่อนแอหนุนการเก็งการลดอัตราดอกเบี้ยของ RBNZในตลาดลงทุนเอเชียวันศุกร์ คู่ NZDUSD ยังคงอยู่ภายใต้แรงขายที่บริเวณ 0.5625
ผู้เขียน  FXStreet
12 เดือน 20 วัน ศุกร์
ในตลาดลงทุนเอเชียวันศุกร์ คู่ NZDUSD ยังคงอยู่ภายใต้แรงขายที่บริเวณ 0.5625
placeholder
GBP/USD ดีดตัวขึ้นสู่ระดับ 1.2540 หลังประกาศข้อมูลเงินเฟ้อของสหรัฐฯ และการประชุมดอกเบี้ยของ BoEคู่ GBP/USD ดีดตัวขึ้นสู่ระดับ 1.2540 หลังจากการเปิดเผยข้อมูลเงินเฟ้อของสหรัฐฯ และการตัดสินใจนโยบายการเงินของธนาคารกลางอังกฤษ (BoE) ในวันพฤหัสบดี ในขณะเดียวกัน ทั้งคู่ได้รับประโยชน์จากข้อมูลการใช้จ่ายเพื่อการบริโภคส่วนบุคคล (PCE) ของสหรัฐฯ ที่อ่อนแอกว่าที่คาดการณ์ไว้ แต่ท่าทีที่ระมัดระวังของ BoE เกี่ยวกับการปรับลดอัตราดอกเบี้ยและข้อมูลยอดค้าปลีกของสหราชอาณาจักรที่อ่อนแอลงทําให้ขาขึ้นยังคงอยู่
ผู้เขียน  FXStreet
3 ชั่วโมงที่แล้ว
คู่ GBP/USD ดีดตัวขึ้นสู่ระดับ 1.2540 หลังจากการเปิดเผยข้อมูลเงินเฟ้อของสหรัฐฯ และการตัดสินใจนโยบายการเงินของธนาคารกลางอังกฤษ (BoE) ในวันพฤหัสบดี ในขณะเดียวกัน ทั้งคู่ได้รับประโยชน์จากข้อมูลการใช้จ่ายเพื่อการบริโภคส่วนบุคคล (PCE) ของสหรัฐฯ ที่อ่อนแอกว่าที่คาดการณ์ไว้ แต่ท่าทีที่ระมัดระวังของ BoE เกี่ยวกับการปรับลดอัตราดอกเบี้ยและข้อมูลยอดค้าปลีกของสหราชอาณาจักรที่อ่อนแอลงทําให้ขาขึ้นยังคงอยู่
ตราสารที่เกี่ยวข้อง
goTop
quote