Curve DAO price surges above $1, highest level since April 2023
- Curve DAO price soars by more than 60% so far this week, reaching levels not seen since April 2023.
- CRV’s scrvUSD stablecoin launches on Spectra ecosystem, attracting more investors to Curve DAO.
- On-chain metrics support the bullish outlook as CRV’s daily trading volume reaches record levels.
Curve DAO (CRV) extends gains by more than 30% on Wednesday, rallying 70% so far this week and reaching levels not seen since April 2023. On Tuesday, the announcement of CRV’s scrvUSD stablecoin launch on the Spectra ecosystem fueled the ongoing rally. The technical outlook and on-chain metrics suggest further gains ahead, as both CRV’s daily trading volume and the staking amount are rising.
Curve DAO’s scrvUSD launches on Spectra
Curve DAO’s recently launched decentralized yield-bearing stablecoin, Savings-crvUSD (scrvUSD), went live in the Spectra ecosystem on Tuesday. The scrvUSD offers low-risk returns for investors and helps scale the crvUSD stablecoin, attracting more investors to the Curve DAO ecosystem.
Yield markets are very very important, and for Savings crvUSD @spectra_finance is one of the first to go uphttps://t.co/oYiYVGAn8k https://t.co/ybCn95uq7K
— Curve Finance (@CurveFinance) December 3, 2024
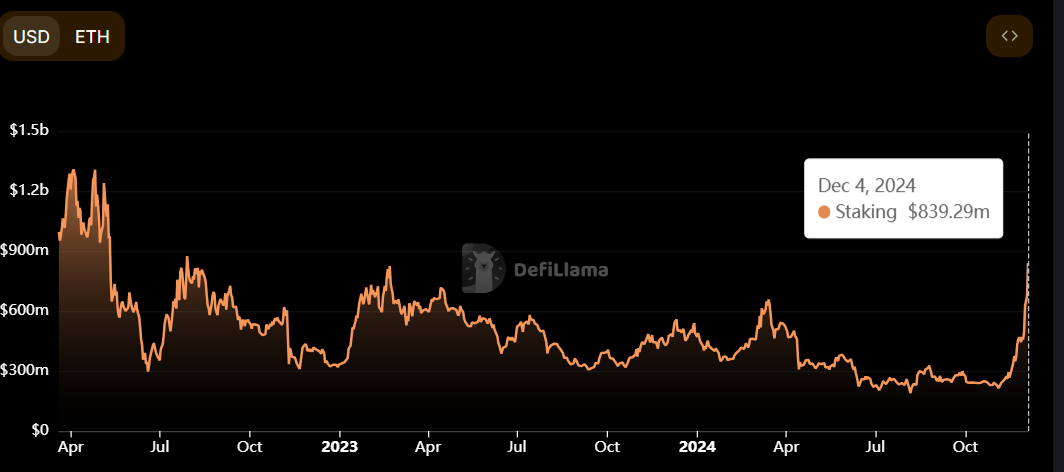
Apart from the stablecoin launch, on-chain metrics also support CRV’s bullish outlook. Crypto intelligence tracker DefiLlama data shows that CRV’s total staking amount has almost doubled from $445.31 million on November 27 to $839.29 million on Wednesday, the highest level since June 2022.
This rise in staking indicates that more investors actively engage with the CRV’s network, suggesting increased adoption.

CRV’s staking amount chart. Source: DefiLlama
Another aspect bolstering the platform’s bullish outlook is a recent surge in traders’ interest and liquidity in the CRV’s chain. Artemis data shows that CRV’s daily trading volume reached $1.6 billion on Tuesday, an all-time high since its launch in 2020.
-638688982087932699.jpg)
CRV’s Daily volume chart. Source: Artemis
Curve DAO Price Forecast: CRV bulls eye for $1.50 mark
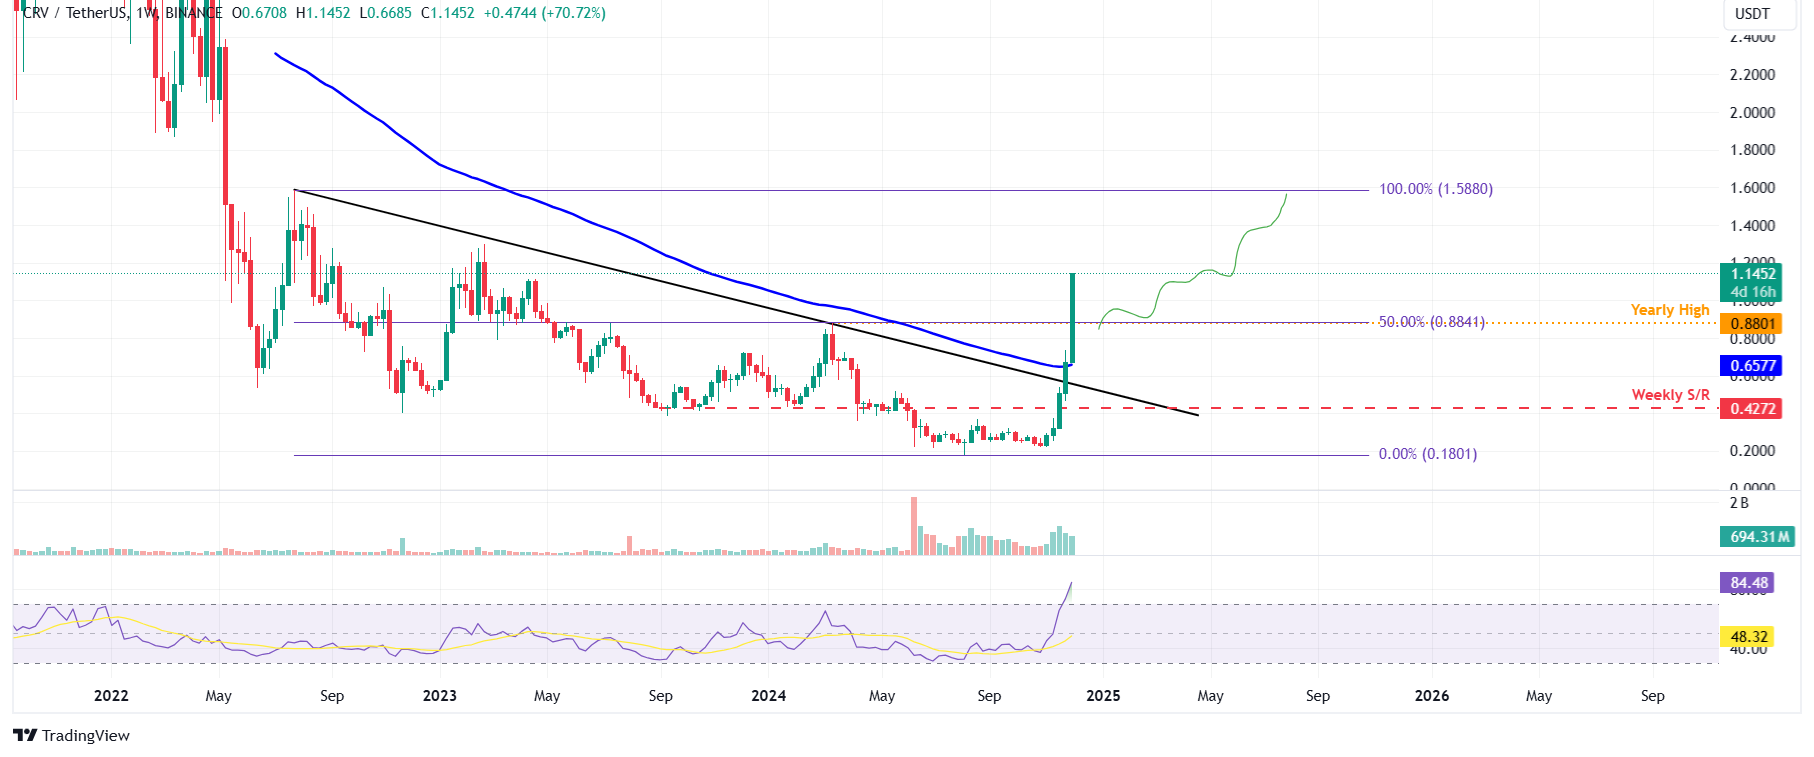
Curve DAO price broke above the descending trendline drawn by connecting multiple weekly high levels from the end of July 2022. At the start of this week, the upward trend extended, rallying 70% until Wednesday, breaking above the 50% price retracement level of $0.88 (drawn from a July 2022 high of $1.58 to the August 2024 low of $0.180).
If CRV price continues to increase, it could extend the rally by more than 40% to retest its July 2022 high of $1.58.
The weekly chart’s Relative Strength Index (RSI) stands at 84, trading well above its overbought level of 70. Traders should be cautious when adding to their long positions because the chances of a price pullback are increasing. Still, the RSI is still pointing upwards, so there is the possibility that the rally continues and the indicator remains above the overbought level.

CRV/USDT weekly chart


