PEPE Price Forecast: Bulls trigger 16% rally after $175M supply squeeze
- PEPE price rose 16% to reach $0.000021 on Thursday, outperforming rival mega cap memes including Shiba Inu and Dogecoin.
- Prior to the breakout, PEPE holders moved tokens worth $175 million into long-term storage over five days.
- Having breached the $0.000020 resistance, bullish technical indicators could attract new market entrants.
Pepe emerged as the best-performing mega cap memecoin on Thursday, breaking past the vital $0.000020 resistance. Technical indicators and current market supply dynamics suggest more upside ahead.
PEPE price spikes 16% as Ethereum memes take center stage
On November 14, PEPE price soared to new all-time highs. Amid dwindling market volumes and Solana memes dominating media trends, PEPE succumbed to an instant correction.
However, after a week-long consolidation, Ethereum's second-largest meme token flashed breakout signals on Thursday.

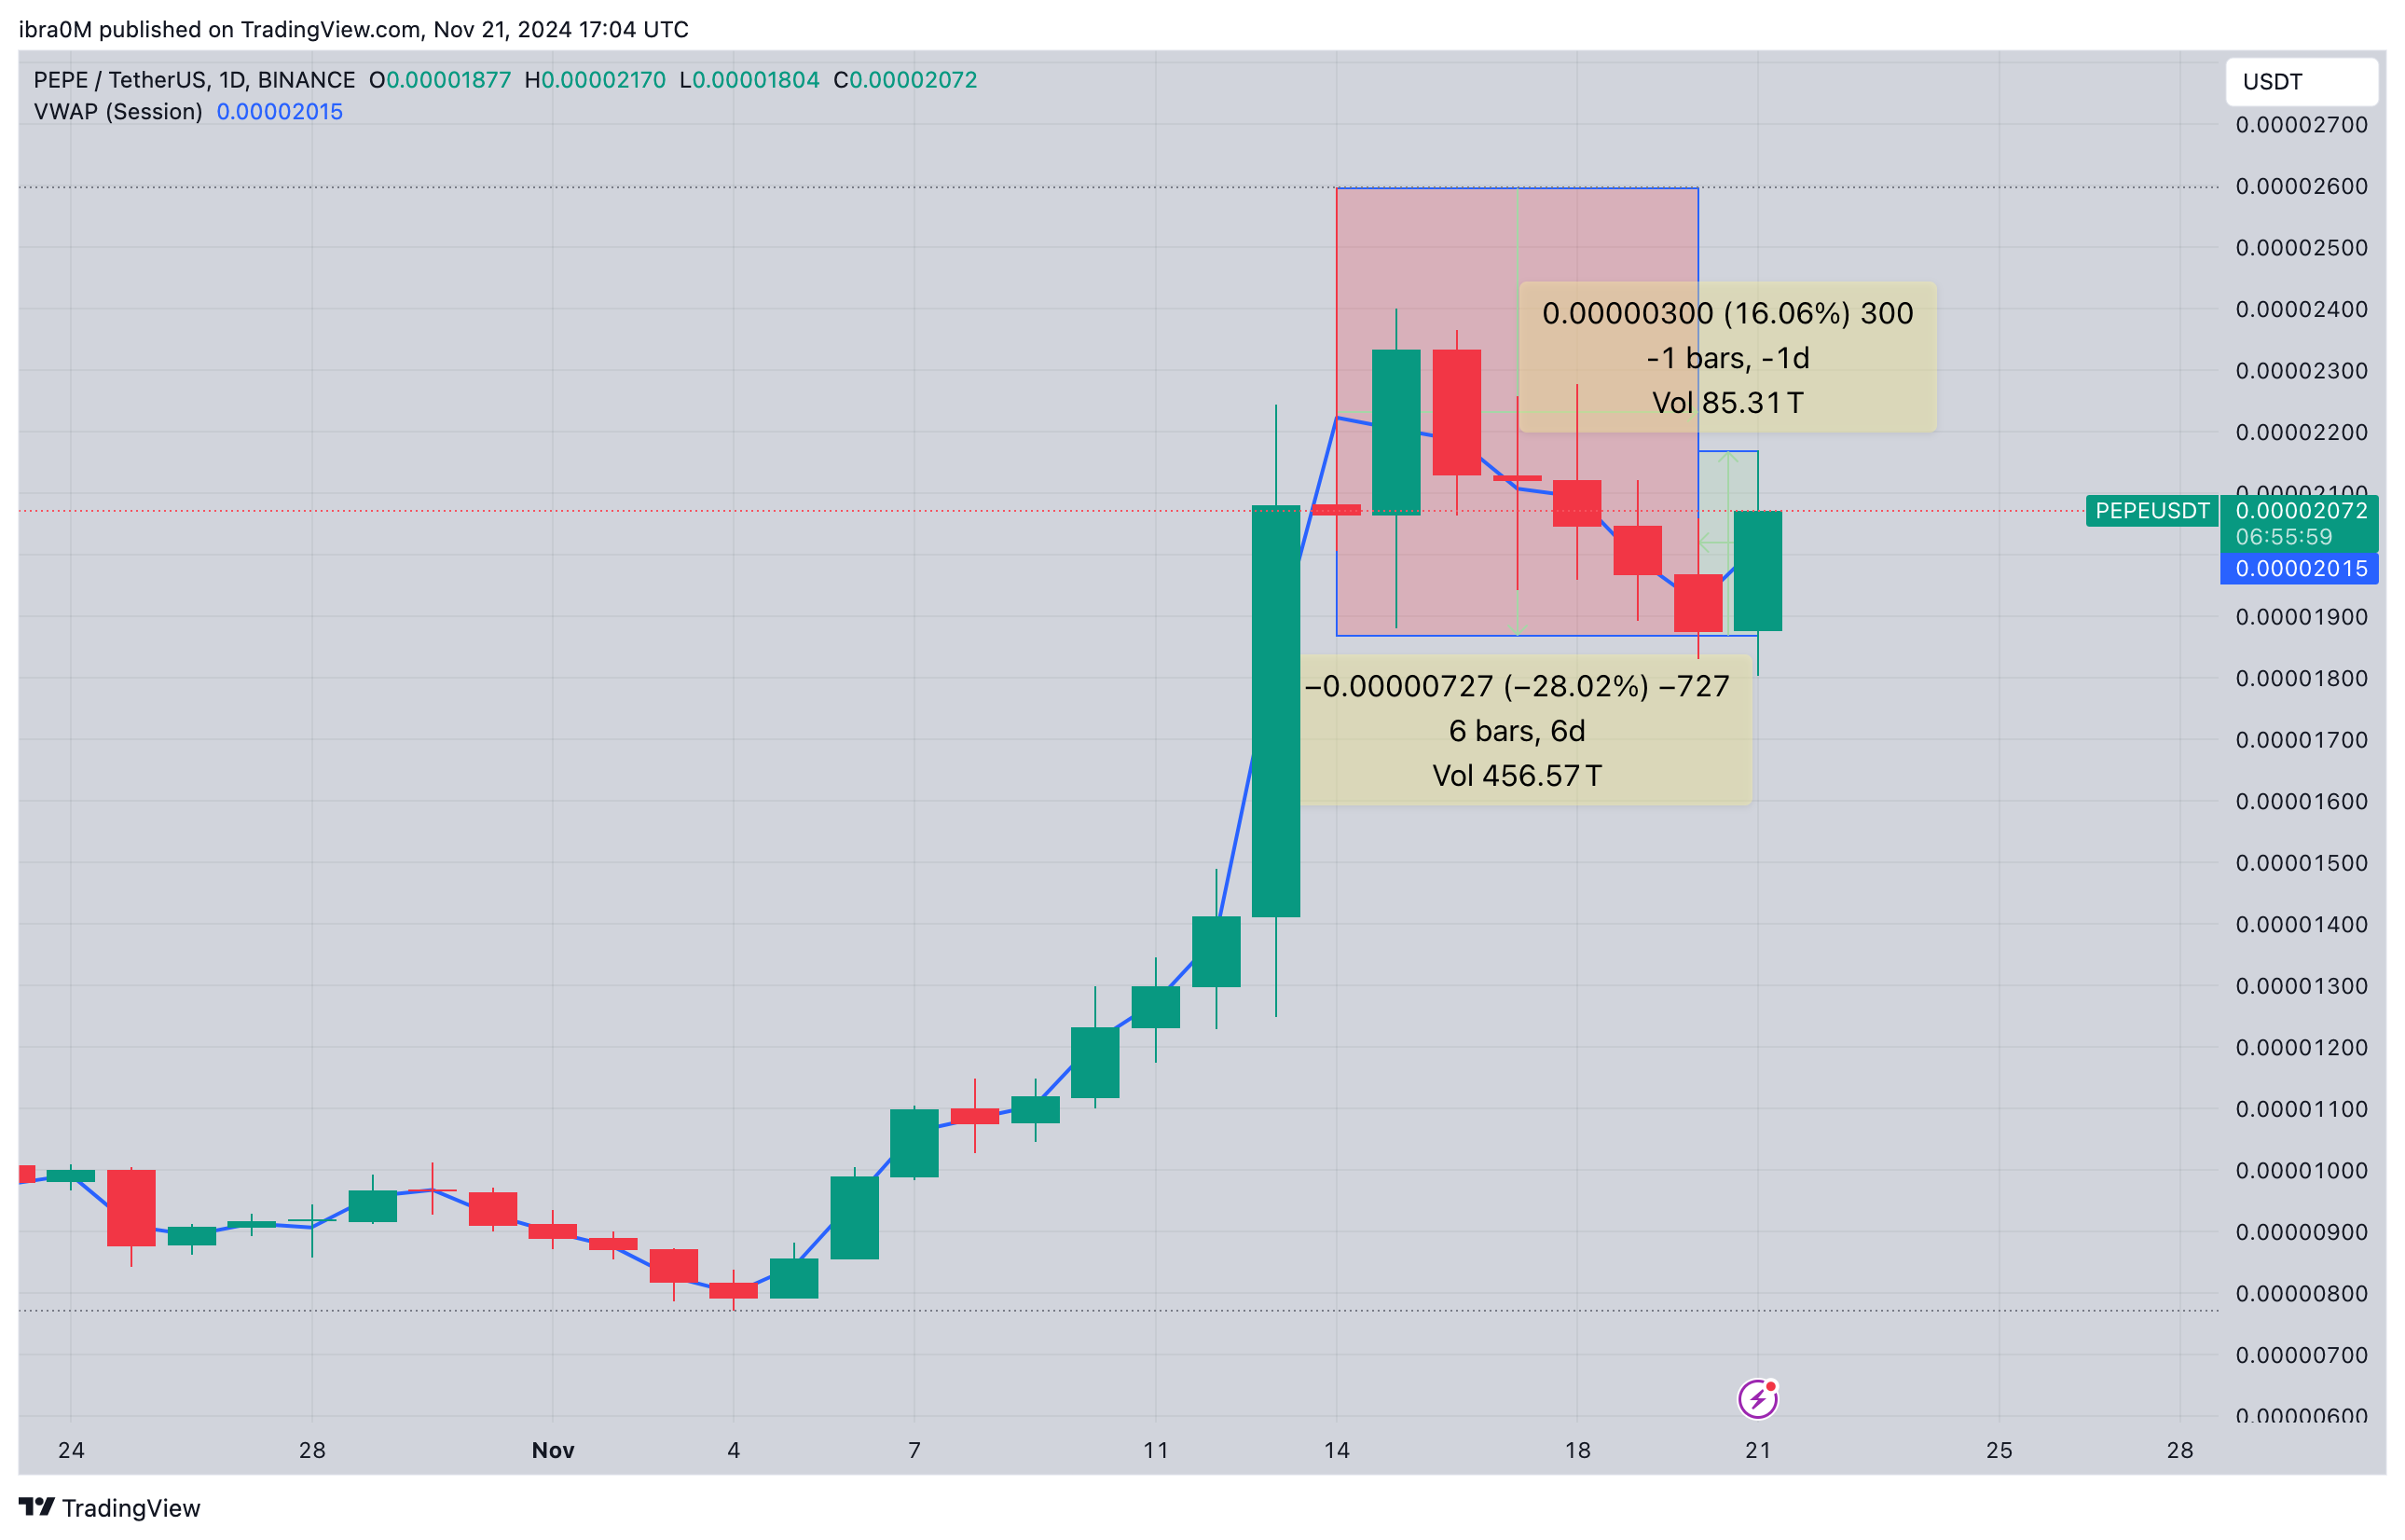
PEPE price action | PEPEUSDT
Looking at the chart above, PEPE opened trading at $0.000018 on November 21, down 27%, in five consecutive losing days after rejecting the global peak of $0.000026 recorded on November 14.
However, at press time on Thursday, PEPE price has advanced to $0.000021, reflecting 16% gains within the daily time frame.
Market trends suggest that as Bitcoin price crossed the $98,000 level on Thursday, the bullish tailwinds spread toward the Ethereum memecoin sector, driving the likes of PEPE, Floki Inu and MOG into double-digit gains, while Solana memes stumbled.
PEPE market supply dipped $175M over five days prior to current rally
Notably, PEPE’s all-time high rally on November 14 was largely driven by its listing on Robinhood, along with the likes of XRP and Cardano.
Asides from the resulting market expansion, the Robinhood listing also eases regulatory pressure around the listed tokens.
Consequently, on-chain data trends observed over the past week shows investors took a more bullish stance on PEPE long-term prospects.
In confirmation of this narrative, the Coinglass Exchange Netflows chart below tracks the daily flows of deposits and withdrawals across major trading platforms.
This serves as a proxy for monitoring the trading sentiment among existing holders of a cryptocurrency.

PEPE exchange netflows | Source: Coinglass
According to the chart above, PEPE holders shifted $175 million worth of tokens out of exchange-hosted wallets in five consecutive days of outflows between November 16 and November 20.
Such a large and persistent decline in exchange deposits effectively shrinks market supply, clearing the part for a parabolic breakout when demand spikes.
This partly explains why PEPE surged 16% within the daily time frame on Thursday, amid bullish tailwinds from BTC’s record-breaking price action.
More so, PEPE exchange inflows rose $17.5 million on November 21, signaling an increase in short-term market volumes supporting the rally.
Considering that this is 90% lower than the outflows recorded in the weekly time frame, a further increase in market volumes in the near term will likely drive PEPE prices higher.
PEPE price forecast: $0.000030 breakout ahead?
PEPE price reclaimed the $0.0000020 territory on Thursday, amid a 16% rally supported by a $17.5 million surge in market inflows.
In addition to the positively skewed market supply dynamics, technical indicators on the PEPE daily charts are signaling a potential breakout toward $0.000030 in the days ahead.
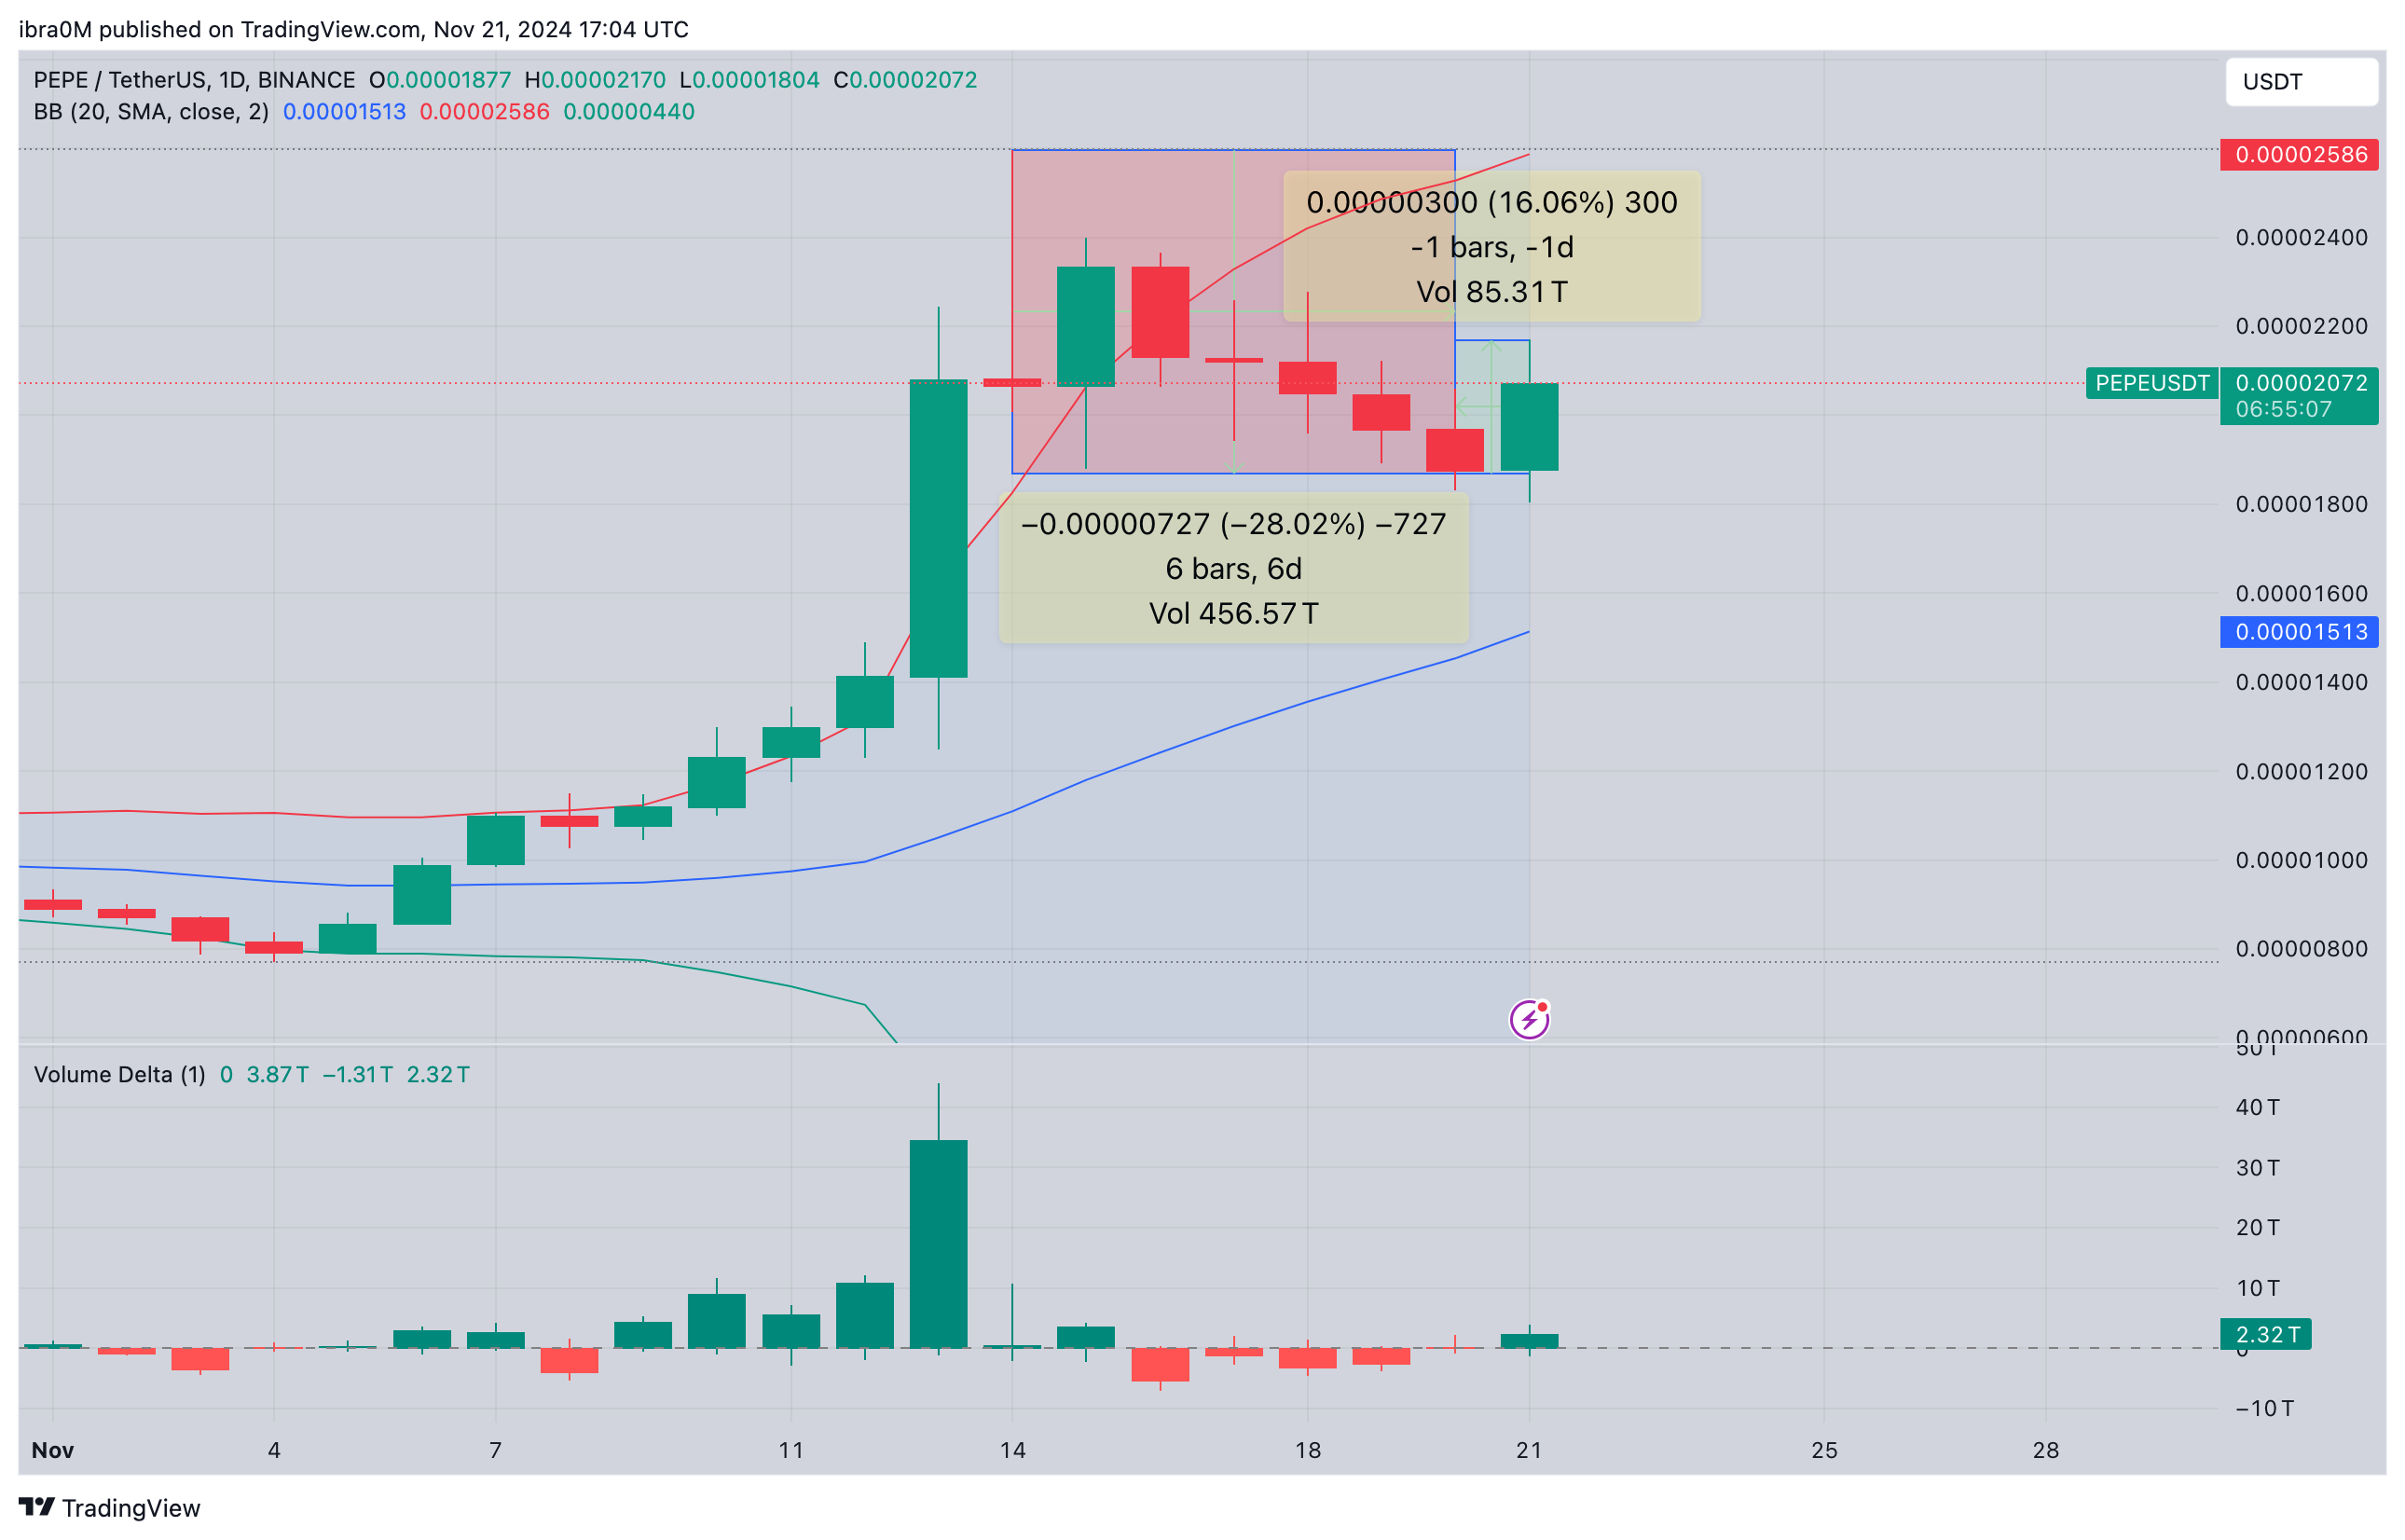
The daily time frame rally has pushed PEPE to the upper Bollinger band, signaling heightened volatility and potential upside momentum.
More so, the Volume Delta flipped into positive values for the first time this week, confirming that the recent rally is backed by strong buying pressure.

PEPE Price Forecast | PEPEUSD
Based on these factors, PEPE price is likely to maintain a bullish outlook, with the previous market top of $0.0000258 posing the immediate resistance level.
If bulls manage to clear that level, a breakout toward new all-time highs above $0.000030 territory could be on the cards.
However, failure to close above the $0.0000020 psychological support could invalidate the positive outlook, especially if accompanied by a drop in trading volumes.

