Solana reaches new yearly high, eyes all-time record levels

แหล่งที่มา Fxstreet
  • Solana hit a new yearly high of $224 on Monday, following a rally of almost 30% the previous week.
  • The weekly chart shows the breakout of a bullish pattern; the technical target is a new all-time high of $276.
  • SOL’s open interest hit a new all-time high on Tuesday, while its DEX trading volume reached its highest since mid-April.

Solana (SOL) trades slightly lower on Tuesday after reaching a new yearly high of $224 on Monday, driven by a nearly 30% rally the previous week. The technical outlook suggests a bullish breakout pattern and continuation of the rally, with a target set for a new all-time high of $276. 

On-chain data further supports the bullish thesis as SOL’s open interest reached a new all-time high on Tuesday, signaling a surge of new capital, while its DEX trading volume reached its highest since mid-April.

Solana technical outlook projects a new all-time high

Solana’s weekly chart shows it has broken above the downward-sloping parallel channel pattern at around $210.18 and rallied over 29.25% last week. This pattern is formed by connecting multiple weekly highs and lows with two trendlines (from early March to October). A breakout of this pattern, confirmed by a weekly close above the breakout level, favors the bulls.

As of this week, it continues to rally, breaking above its previous yearly high and forming a new one at $224. 

The pattern’s technical target (obtained by measuring the distance between the two trendlines and extrapolating it higher) projects a new ATH of $276.55.

The Relative Strength Index (RSI) momentum indicator on the weekly chart reads at 66, above its neutral level of 50 and still far below overbought conditions, suggesting bullish momentum is gaining traction.
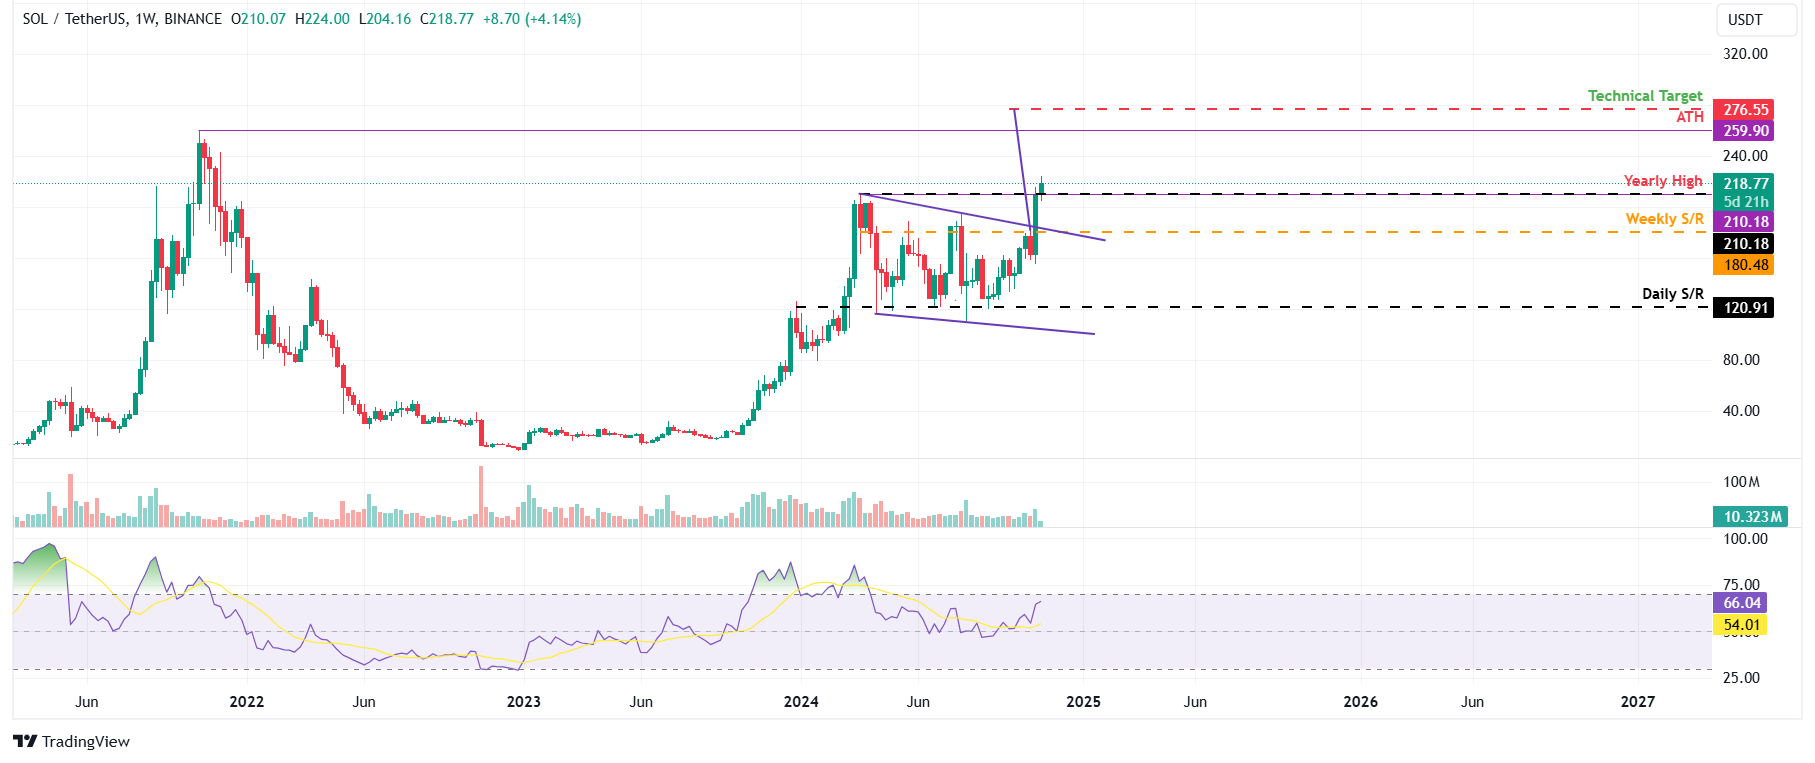
SOL/USDT weekly chart

SOL/USDT weekly chart

Solana’s on-chain data further supports the bullish thesis. Coinglass’s data shows that the futures’ Open Interest (OI) in SOL at exchanges is increasing. Increasing OI represents new or additional money entering the market and new buying, which suggests a bullish trend. 

The graph below shows that SOL’s OI rose from $2.88 billion on November 5 to $4.54 billion on Tuesday, a new all-time high.

SOL Open Interest chart. Source: Coinglass

SOL Open Interest chart. Source: Coinglass

Another aspect bolstering the platform’s bullish outlook is a recent surge in traders’ interest and liquidity in the SOL chain. Artemis Terminal data shows that SOL Chain’s decentralized exchange (DEX) trading volume rose from $1.9 billion on Friday to $4.6 billion on Monday, the highest since mid-April. 

Solana DEX trading volume chart. Source: Artemis

Solana DEX trading volume chart. Source: Artemis

ข้อจำกัดความรับผิดชอบ: เพื่อการอ้างอิงเท่านั้น ผลการดำเนินงานในอดีตไม่ได้บ่งบอกถึงผลลัพธ์ในอนาคต
placeholder
ราคา XRP มีแนวโน้มสูงขึ้นได้อย่างยั่งยืนทนายความคาดว่าจะสามารถจบคดี Ripple มูลค่า 20 ล้านดอลลาร์ได้ Ripple อาจจ่ายเงินค่าปรับ 20 ล้านดอลลาร์ได้ นี่อาจจะเป็นชัยชนะต่อคณะกรรมการ ก.ล.ต. ตามที่ทนายความ John Deaton ได้กล่าวไว้
ผู้เขียน  Mitrade
วันที่ 09 พ.ย. 2023
Ripple อาจจ่ายเงินค่าปรับ 20 ล้านดอลลาร์ได้ นี่อาจจะเป็นชัยชนะต่อคณะกรรมการ ก.ล.ต. ตามที่ทนายความ John Deaton ได้กล่าวไว้
placeholder
FED จะเริ่มลดอัตราดอกเบี้ยในปี 2024 และคาดว่าทองคำจะก้าวเข้าสู่ระดับสูงสุดเป็นประวัติการณ์ที่ 2,147 ดอลลาร์ขณะนี้ราคาทองคำกำลังแข็งค่าอย่างแข็งแกร่งโดยอยู่ที่ประมาณ 2,050 ดอลลาร์ แนวต้านด้านบนอยู่ที่ 2,090 ดอลลาร์และระดับ 2,110 ดอลลาร์ และแนวรับที่ต่ำกว่าอยู่ที่ 2,010 ดอลลาร์และ 1,980 ดอลลาร์
ผู้เขียน  Mitrade
วันที่ 28 ธ.ค. 2023
ขณะนี้ราคาทองคำกำลังแข็งค่าอย่างแข็งแกร่งโดยอยู่ที่ประมาณ 2,050 ดอลลาร์ แนวต้านด้านบนอยู่ที่ 2,090 ดอลลาร์และระดับ 2,110 ดอลลาร์ และแนวรับที่ต่ำกว่าอยู่ที่ 2,010 ดอลลาร์และ 1,980 ดอลลาร์
placeholder
วิเคราะห์ราคา EUR/USD: ขยับสูงขึ้นเล็กน้อยเข้าใกล้ 1.0900; แนวต้านถัดไปอยู่ที่ระดับสูงสุดในรอบสี่เดือนEUR/USD ปรับตัวขึ้นเป็นวันที่สองติดต่อกัน โดยซื้อขายที่บริเวณระดับ 1.0900 ในช่วงเซสชั่นเอเชียของวันอังคาร การวิเคราะห์กราฟรายวันแสดงให้เห็นถึงการอ่อนตัวลงของแนวโน้มขาขึ้น เมื่อคู่สกุลเงินดังกล่าวบริเวณใต้กรอบเทรนด์ไลน์ลาดขึ้น
ผู้เขียน  FXStreet
7 เดือน 23 วัน อังคาร
EUR/USD ปรับตัวขึ้นเป็นวันที่สองติดต่อกัน โดยซื้อขายที่บริเวณระดับ 1.0900 ในช่วงเซสชั่นเอเชียของวันอังคาร การวิเคราะห์กราฟรายวันแสดงให้เห็นถึงการอ่อนตัวลงของแนวโน้มขาขึ้น เมื่อคู่สกุลเงินดังกล่าวบริเวณใต้กรอบเทรนด์ไลน์ลาดขึ้น
placeholder
Bitcoin ทะลุ 93,000 ดอลลาร์ – เป็นไปได้หรือไม่ที่จะแตะ 100,000 ดอลลาร์ก่อนสุดสัปดาห์?Bitcoin กำลังฉีกขาด ก่อนหน้านี้ทะลุ 93,000 ดอลลาร์เป็นครั้งแรกในประวัติศาสตร์ โดยพุ่งขึ้นกว่า 3% และสร้างสถิติใหม่ที่ 93,469.08 ดอลลาร์
ผู้เขียน  Cryptopolitan
11 เดือน 14 วัน พฤหัส
Bitcoin กำลังฉีกขาด ก่อนหน้านี้ทะลุ 93,000 ดอลลาร์เป็นครั้งแรกในประวัติศาสตร์ โดยพุ่งขึ้นกว่า 3% และสร้างสถิติใหม่ที่ 93,469.08 ดอลลาร์
placeholder
Bitcoin ลดลงเหลือ 88,000 ดอลลาร์จากระดับสูงสุดตลอดกาลBitcoin ลดลงเหลือ 88,000 ดอลลาร์ หลังจากแตะ ATH ที่ 93,000 ดอลลาร์ต่อวันก่อนหน้านี้ Bitcoin มีโมเมนตัมเชิงบวกหลังจากการประกาศผล dent ในปี 2024 และเพิ่มขึ้น 35% ในเดือนที่ผ่านมา อย่างไรก็ตาม มันได้ลดลงตั้งแต่นั้นมาและมีความผันผวนระหว่าง 88,000 ถึง 89,000 ตามข้อมูลของ Coinmarketcap
ผู้เขียน  Cryptopolitan
11 เดือน 15 วัน ศุกร์
Bitcoin ลดลงเหลือ 88,000 ดอลลาร์ หลังจากแตะ ATH ที่ 93,000 ดอลลาร์ต่อวันก่อนหน้านี้ Bitcoin มีโมเมนตัมเชิงบวกหลังจากการประกาศผล dent ในปี 2024 และเพิ่มขึ้น 35% ในเดือนที่ผ่านมา อย่างไรก็ตาม มันได้ลดลงตั้งแต่นั้นมาและมีความผันผวนระหว่าง 88,000 ถึง 89,000 ตามข้อมูลของ Coinmarketcap
ตราสารที่เกี่ยวข้อง
goTop
quote