
Bitcoin set for second straight week of gains as on-chain metrics signal rally
- Bitcoin price tests resistance at $43,000, recovering from a week-long slump.
- Bitcoin on-chain metrics signal a likelihood of a BTC price rally.
- BTC profit-taking by whales has declined, paving the way for extended price gains.
Bitcoin (BTC) price tested resistance at $43,000 on Friday, recovering from declines earlier this week, in a sign of increasing buying pressure after a choppy week. Some of the asset’s on-chain metrics support the thesis of further price gains ahead, although Bitcoin price has been moving broadly sideways for the last two months.
Also read: Bitcoin price scenarios to consider with approaching BTC halving event
Daily digest market movers: Bitcoin could ride the wave of bullish on-chain metrics
- Bitcoin price sustained above the $43,000 level on Friday, on the way to closing its second consecutive week in the green after a price slump at the beginning of 2024.
- The asset could kick-start a potential rally as on-chain metrics are bullish and renewed BTC ETFs inflows after weeks of massive GBTC outflows.
- These two catalysts – on-chain metrics and net positive flows to ETFs – are likely to emerge as drivers of the Bitcoin price rally.
- An analysis of Bitcoin’s on-chain metrics (whale transactions valued at $100,000 and higher and Network Realized Profit/Loss) suggests that:
- Whale transactions valued at $100,000 and higher have declined between January 17 and February 1.
- As these spikes in whale transactions coincided with Network Realized Profits in the past several weeks, the recent decline in transaction volumes indicates large-wallet investors are reducing their profit taking.
%20[10.54.12,%2002%20Feb,%202024]-638424539550370748.png)
Whale transaction count and Network Realized Profit/Loss. Source: Santiment
- The Social dominance metric, which measures the volume of Bitcoin’s mentions in conversations on platforms like X, shows that there is a decline in BTC’s dominance. Altcoin chatter is likely taking over, and this decline has foreshadowed BTC price increases several times in the past six months..
%20[11.15.20,%2002%20Feb,%202024]-638424539830392348.png)
BTC Social dominance and price. Source: Santiment
- BIT, FBTC, ARKB and BITB ETFs registered capital inflows on each of the first 14 trading days, while Grayscale’s GBTC posted outflows every single day since its conversion, according to data from Bloomberg Intelligence.
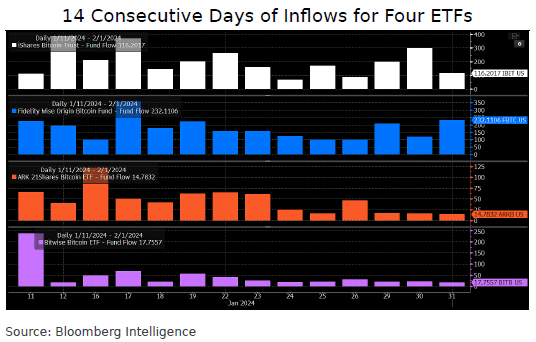
Inflows to BTC ETFs for 14 consecutive days. Source: Bloomberg Intelligence
- Consistent inflows to Bitcoin ETFs signal an increase in BTC demand among market participants as ETF issuers like BlackRock continue to scoop up BTC on OTC markets. This is bullish for Bitcoin in the long-term.
Technical Analysis: Bitcoin price could kick-start bull run
Akash Girimath, technical analyst at FXStreet, notes that Bitcoin price shows no signs of a directional bias in the short-term, the asset is trading around the $43,000 level. Girimath argues that on-chain metrics show clear bullish signs, and that BTC could potentially kick-start a bull run.
Girimath says two scenarios could play out. In the first case, Bitcoin price uptrend could continue after January’s swing low at $38,505. Alternatively, Bitcoin price could correct to the $34,000 level. The analyst notes that traders are expecting a correction that flushes out late long positions and pushes BTC to the $34,000 to $35,000 region. But this correction is highly unlikely, he said.
On the daily timeframe, if Bitcoin price dips into the daily imbalance zone between $41,396 to $40,278, its reaction to the $40,000 region could determine where BTC is headed next. Strong buying pressure has the potential to push Bitcoin to a higher high above $44,000, a moderate buy signal for traders.
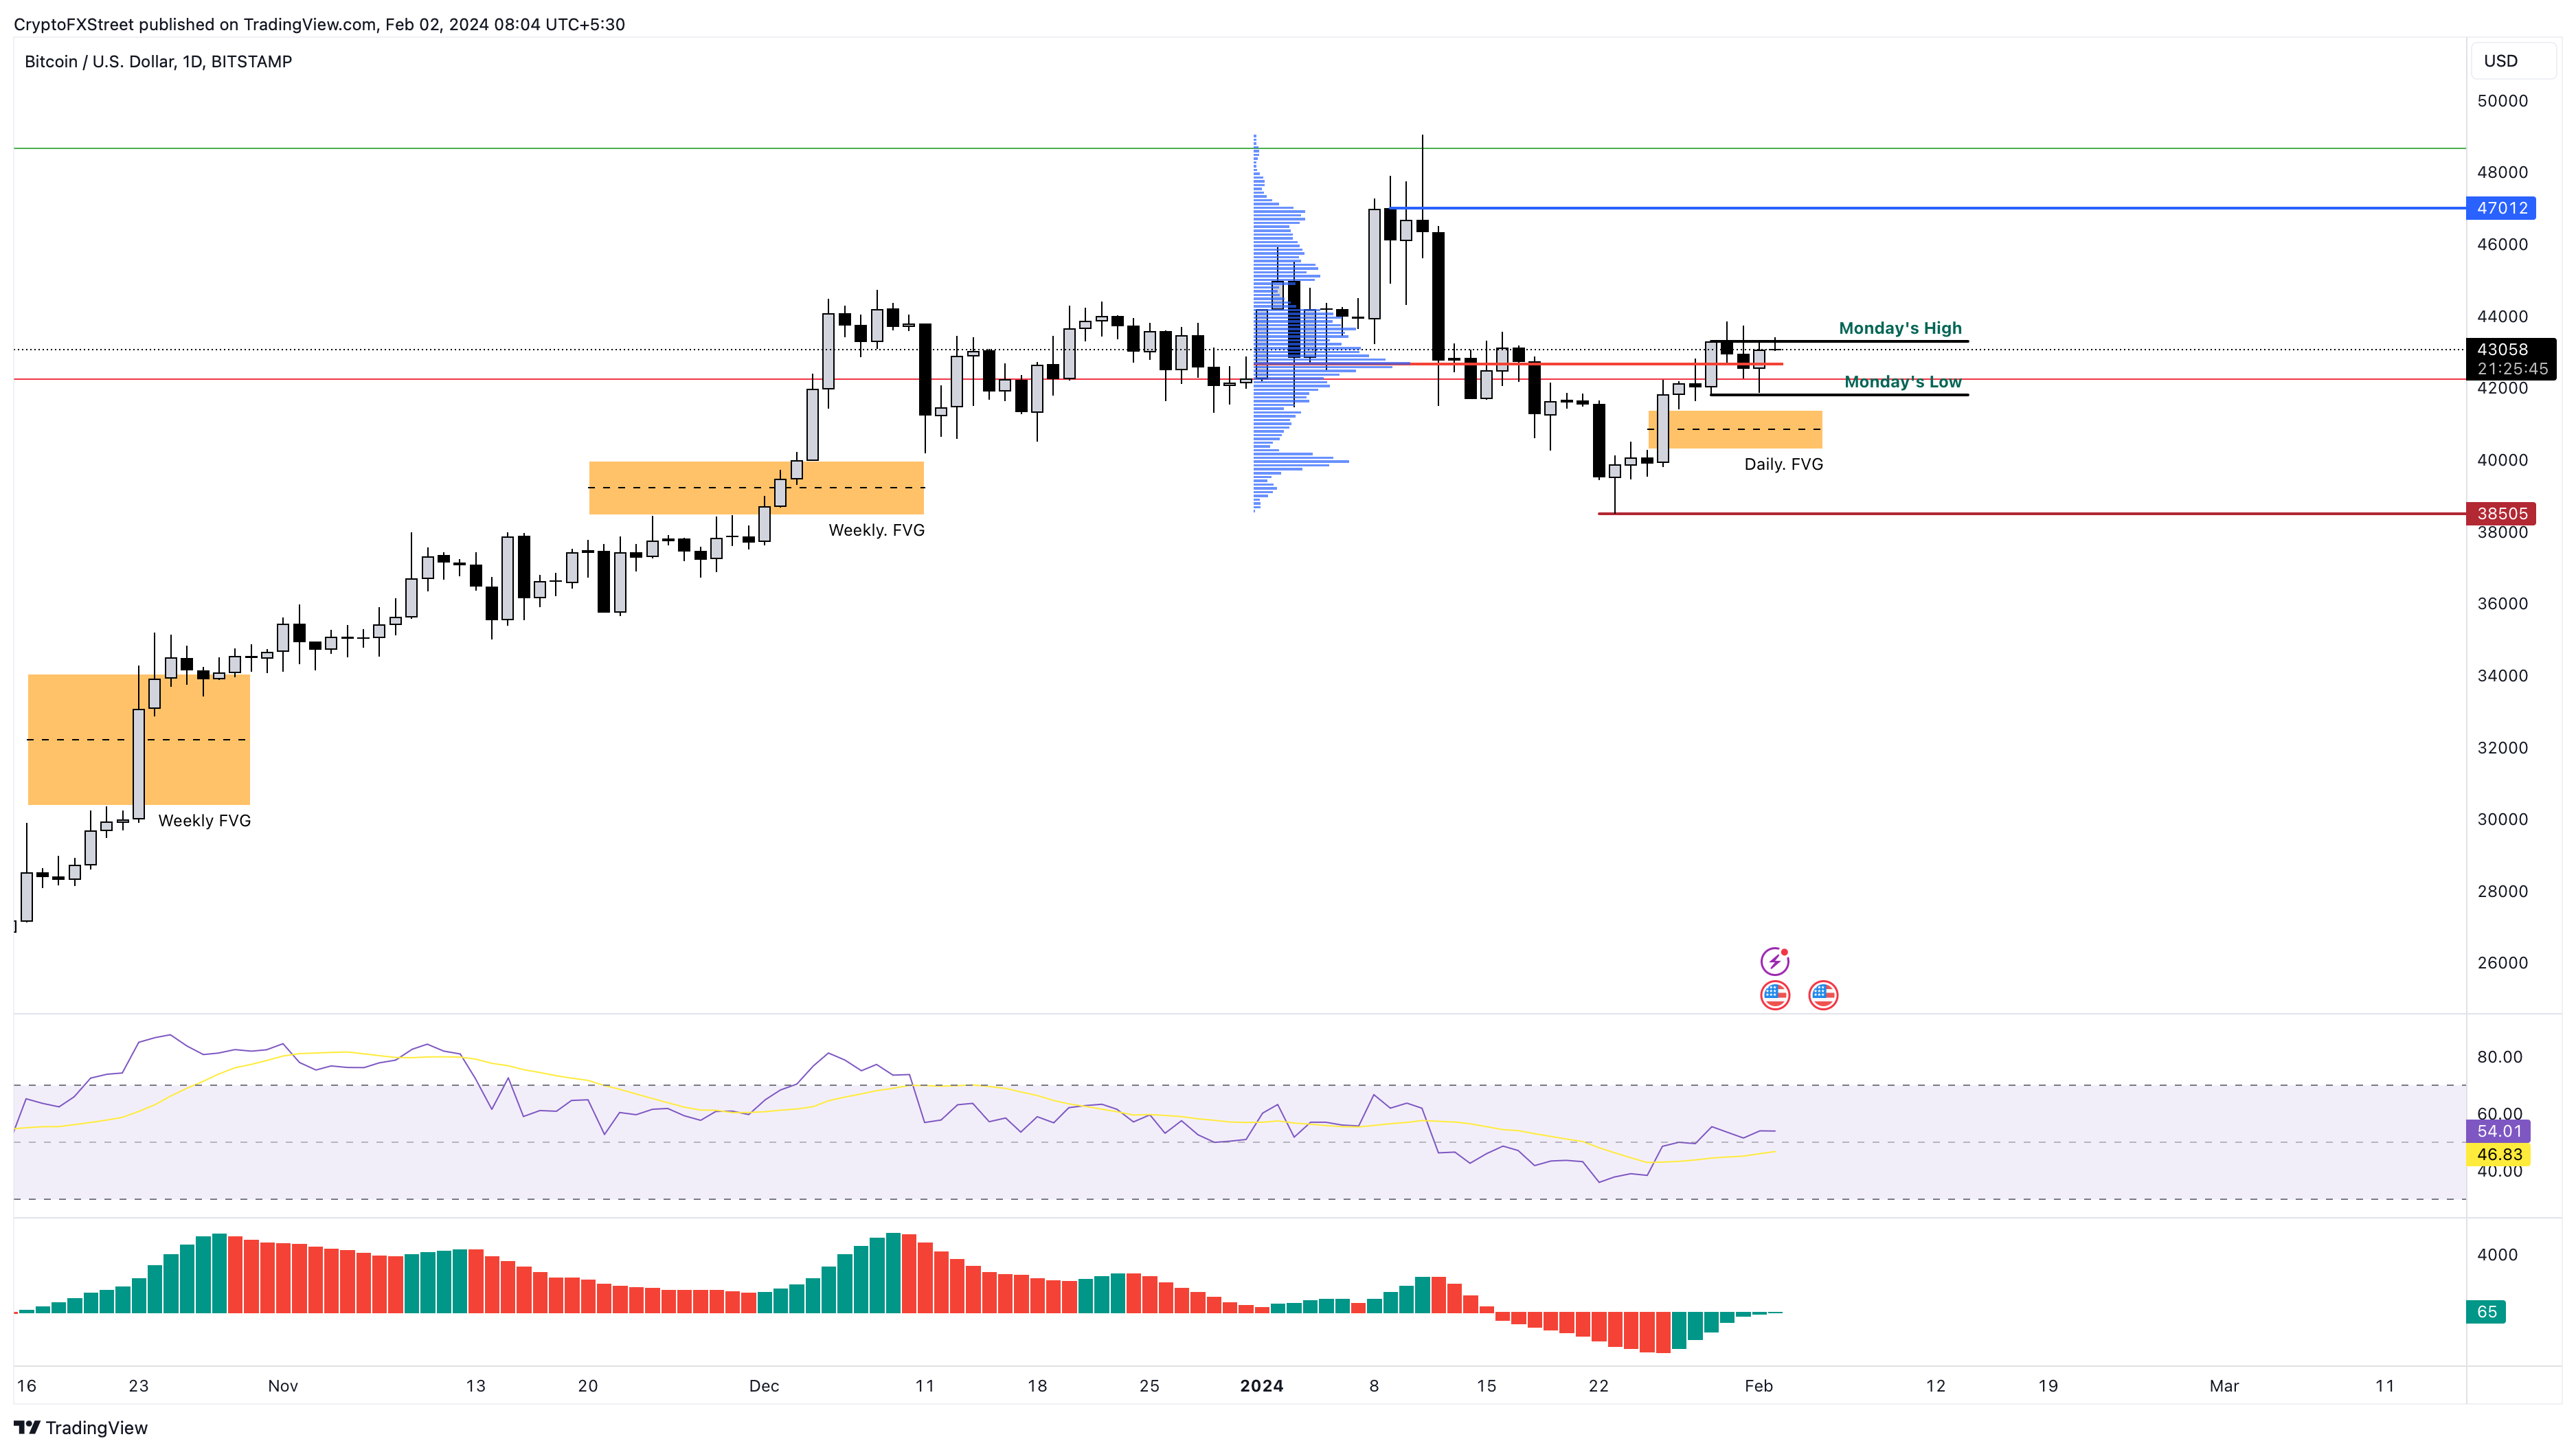
BTC/USD 1-day chart
Ripple FAQs
What is Ripple?
Ripple is a payments company that specializes in cross-border remittance. The company does this by leveraging blockchain technology. RippleNet is a network used for payments transfer created by Ripple Labs Inc. and is open to financial institutions worldwide. The company also leverages the XRP token.
What is XRP?
XRP is the native token of the decentralized blockchain XRPLedger. The token is used by Ripple Labs to facilitate transactions on the XRPLedger, helping financial institutions transfer value in a borderless manner. XRP therefore facilitates trustless and instant payments on the XRPLedger chain, helping financial firms save on the cost of transacting worldwide.
What is XRPL?
XRPLedger is based on a distributed ledger technology and the blockchain using XRP to power transactions. The ledger is different from other blockchains as it has a built-in inflammatory protocol that helps fight spam and distributed denial-of-service (DDOS) attacks. The XRPL is maintained by a peer-to-peer network known as the global XRP Ledger community.
What blockchain technology does XRP use?
XRP uses the interledger standard. This is a blockchain protocol that aids payments across different networks. For instance, XRP’s blockchain can connect the ledgers of two or more banks. This effectively removes intermediaries and the need for centralization in the system. XRP acts as the native token of the XRPLedger blockchain engineered by Jed McCaleb, Arthur Britto and David Schwartz.
บทความแนะนำ


