Uniswap Price Forecast: Technical outlook suggests a bullish breakout ahead
- Uniswap price faces resistance around $8.26; a firm close above suggests a rally ahead.
- The MACD indicator flips into the positive territory amid a bullish crossover.
- A daily candlestick close below $7.08 would invalidate the bullish thesis.
Uniswap (UNI) is trading slightly below $8 on Thursday after rejecting a key resistance level on Wednesday. A successful close above this threshold could indicate a rally for the decentralized exchange, bolstered by technical indicators showing a bullish crossover pointing to potential upward momentum.
Uniswap could have double-digit gains if it closes above the key resistance level
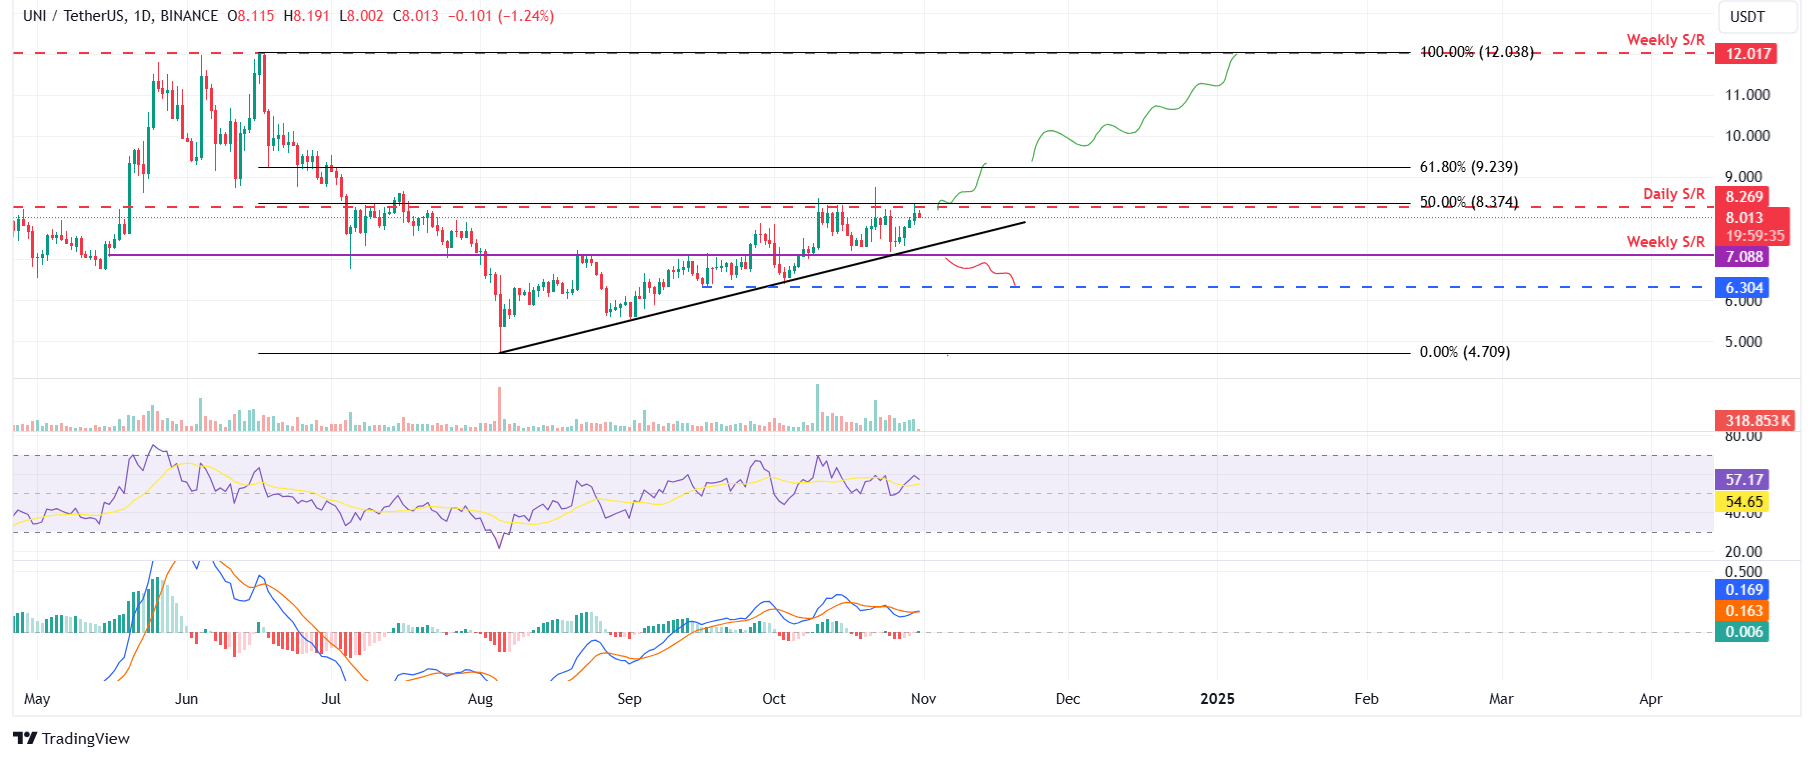
Uniswap has struggled to break through the daily resistance level around $8.26, which roughly coincides with the 50% price retracement at $8.37. It was again rejected on Wednesday. At the time of writing on Thursday, it trades slightly down around $8.01.
If UNI breaks above the daily resistance and closes above $8.37, it could rally 10% to retest its 61.8% Fibonacci retracement level at $9.23. A successful close above this level could extend the rally by 30% to retest its next weekly resistance at $12.01.
The Relative Strength Index (RSI) on the daily chart reads at 57, above its neutral level of 50, suggesting that bullish momentum is gaining traction. Moreover, the Moving Average Convergence Divergence (MACD) indicator is also flipping a bullish crossover on the daily chart, indicating an upward momentum on the horizon.

UNI/USDT daily chart
The bullish thesis would be invalidated if UNI fails to break above the daily resistance level and declines to close below the weekly support of $7.08. This scenario would extend the decline to retest the September 16 low of $6.30.

