Solana Price Forecast: SOL hits three-month high above $180 after four-day rally
Solana price today: $180.79
- Solana price increases for a fourth straight day, hitting the $180 resistance for the first time in nearly three months.
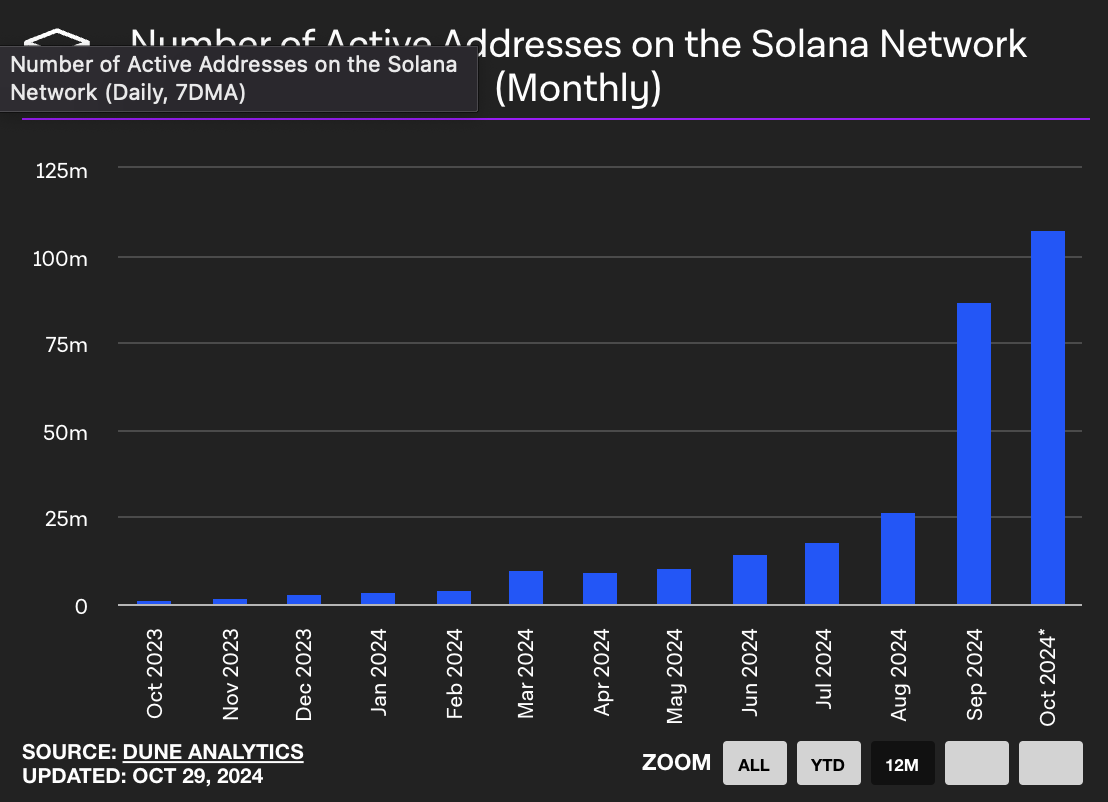
- Active addresses on the Solana blockchain have consistently climbed every month in the past year.
- SOL's upside target is at around $210, its 2024 high seen in March.
Solana (SOL) price climbs for the fourth consecutive day on Tuesday to an almost three-month high above $180. Active addresses on the Solana network are increasing sharply on a monthly basis, suggesting rising demand for the chain among traders and further supporting the optimistic price outlook for its native token.
Solana sees massive spike in monthly active addresses
The number of active addresses on a blockchain counts the number of wallet addresses that were active either as receivers or senders on a specific blockchain.
The monthly count of active addresses on Solana shows a significant gain, according to data from The Block, particularly in the last few months. In October, the metric climbed to 107.04 million. The chart shows the information as incomplete, since there are two more days left for the month to end.

Number of active addresses on the Solana Network in the last twelve months. Source: The Block
On a daily basis, the number of total active addresses was at around 2.68 million on Sunday, down from its October 22 peak of 8.81 million, according to Dune Analytics data. The spike on October 22 can likely be attributed to meme coin activity and transactions on decentralized exchanges in the Solana network.
Solana Price Forecast: SOL could revisit March peak
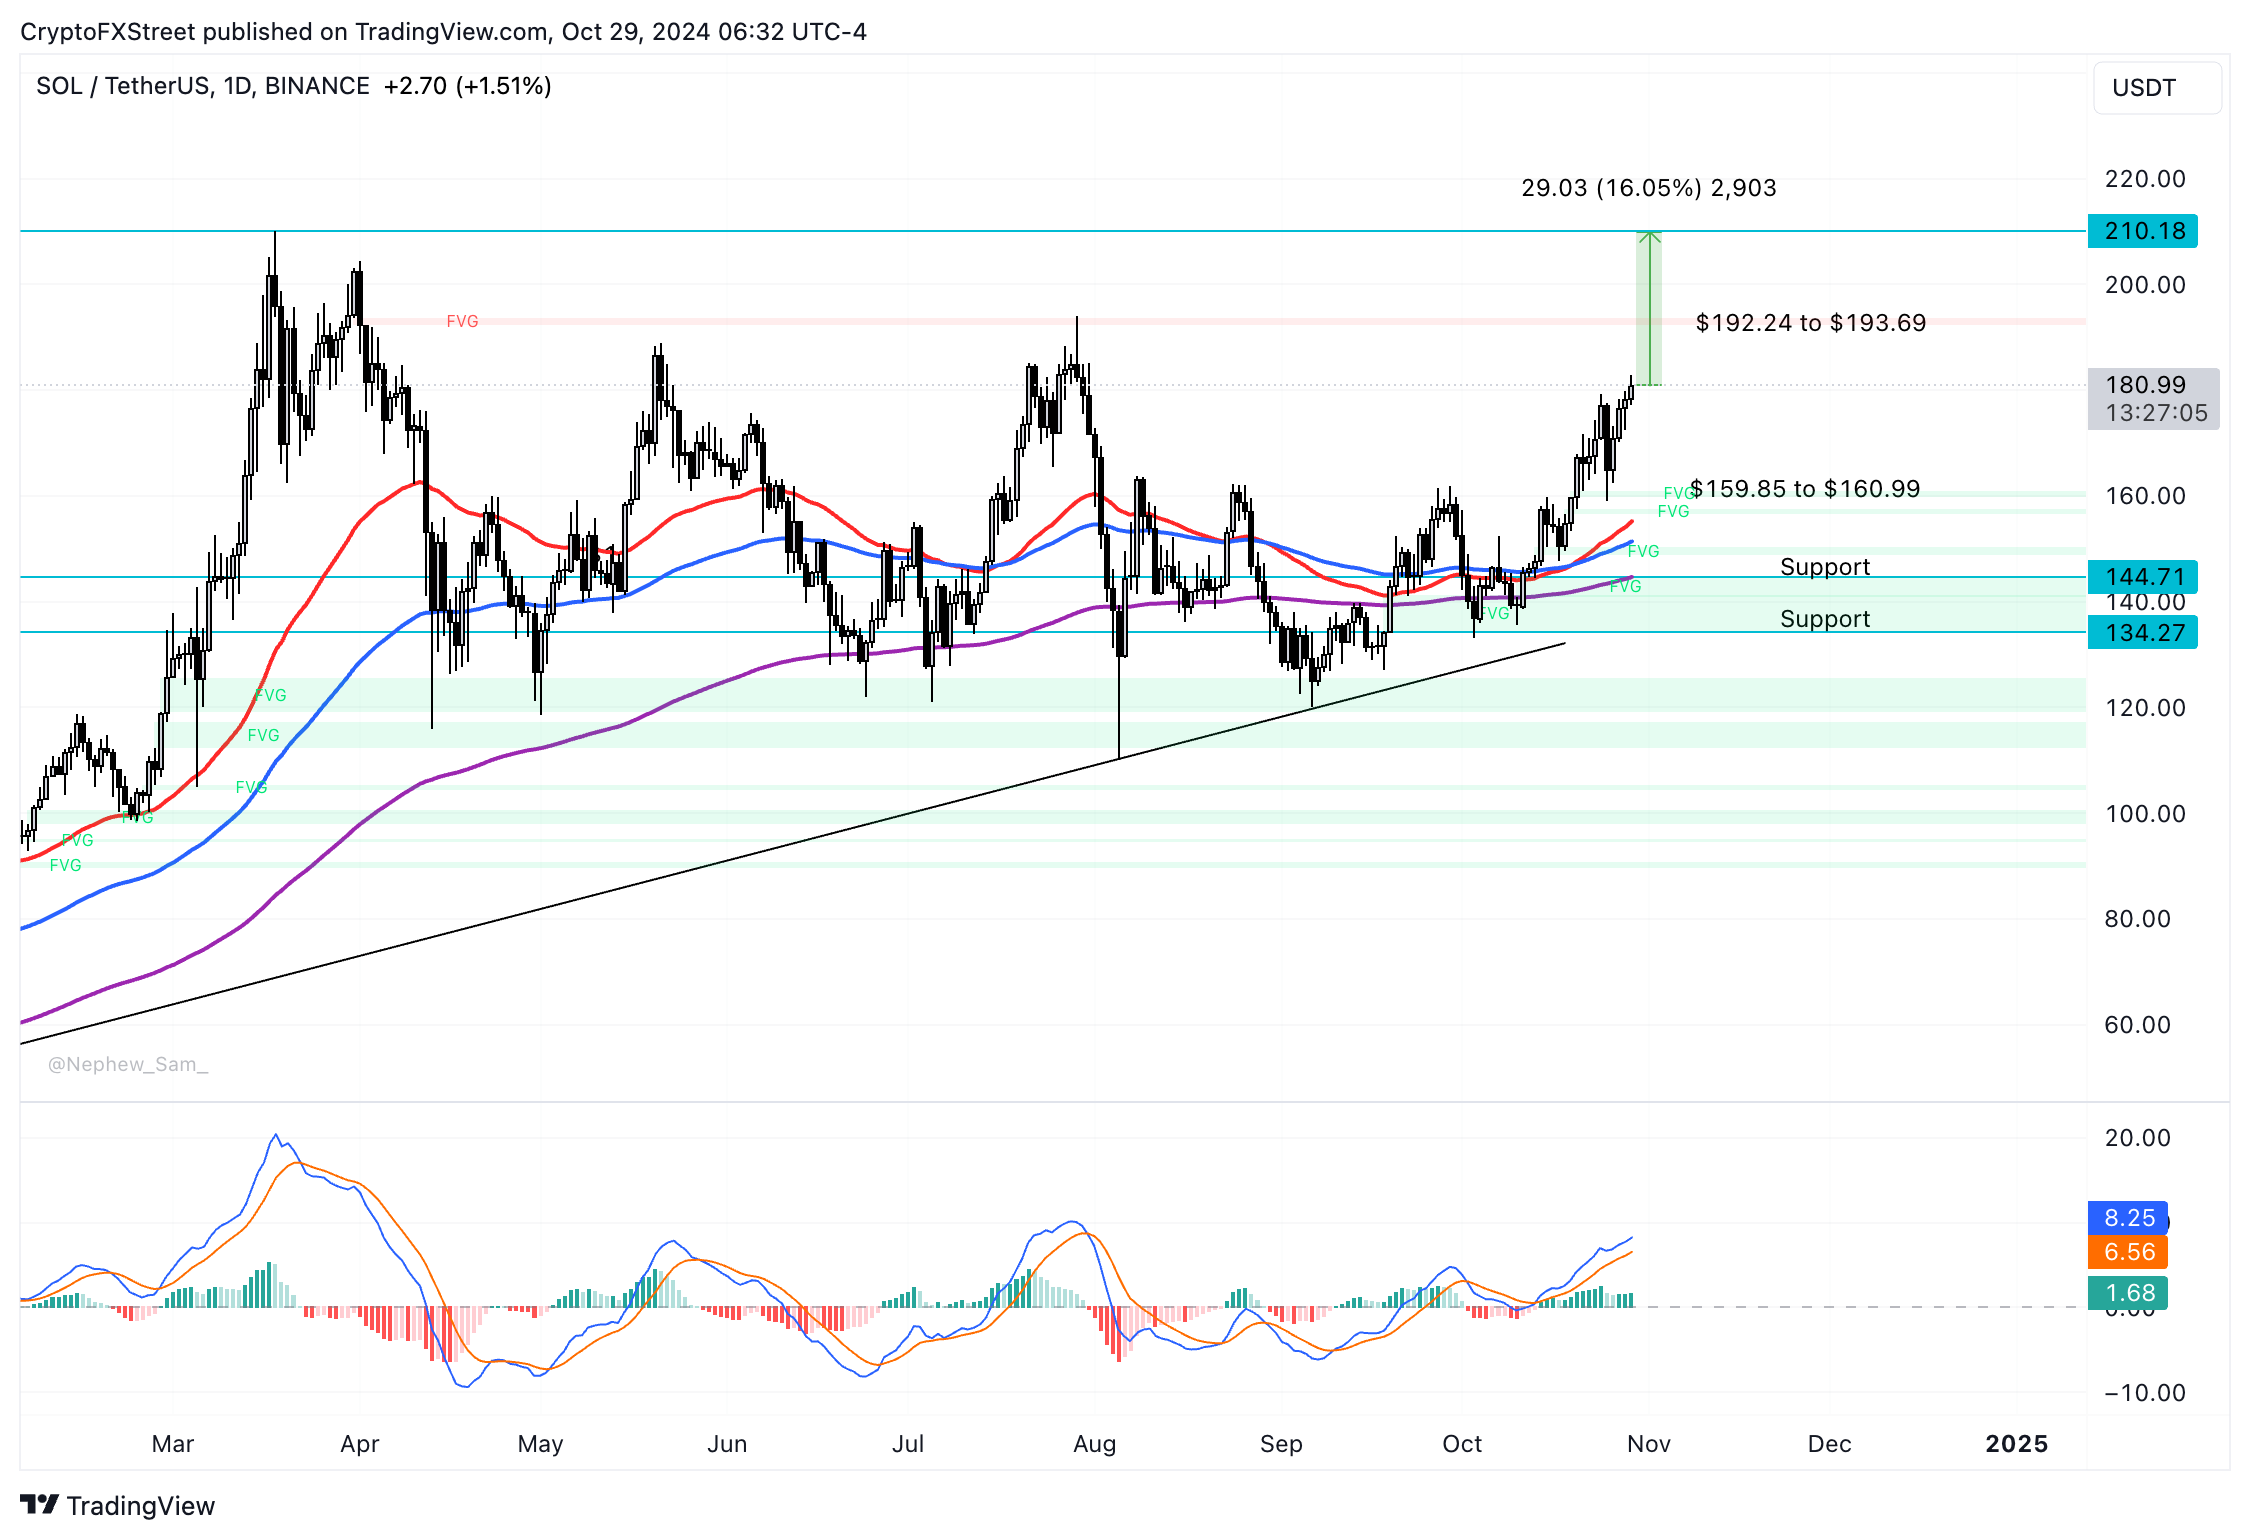
Solana has been on a clear uptrend since the beginning of October. The altcoin is testing resistance at the psychologically important $180 level on Tuesday, and a daily close above it could pave the way for the token to reach the 2024 peak of $210.18 seen on March 18.
A rally to $210.18 would mark a 16% price increase from current levels. On the way to that target, SOL faces resistance in the Fair Value Gap (FVG) extending between $192.24 and $193.69.
The Moving Average Convergence Divergence (MACD), a momentum indicator, shows green histogram bars above the neutral line, signaling positive underlying momentum in SOL price trend.
Meanwhile, the Relative Strength Index (RSI) on the daily chart is at 68, close to overbought levels, suggesting higher chances of a corrective pullback if it enters the area above 70.

SOL/USDT daily chart
If Solana suffers a decline, the altcoin could sweep liquidity in the FVG between $159.85 and $160.99, as seen on the daily price chart. Other key support levels are the Exponential Moving Averages (EMAs) and the upper and lower boundaries of imbalance zones at $144.71 and $134.27.

