SUI Price Forecast: On-chain metrics and technical indicators show bearish bias

แหล่งที่มา Fxstreet
  • SUI’s technical analysis shows a formation of bearish divergence on a momentum indicator.
  • On-chain data suggests a bearish outlook for SUI as the long-to-short ratio is below one, and daily trading volume is decreasing.
  • A daily candlestick close above $2.17 would invalidate the bearish thesis.

Sui (SUI) price continues to decline on Tuesday after reaching a new all-time high of $2.36 on October 13. Technical analysis and onchain data further support a short-term decline, as the formation of bearish divergence on a momentum indicator and decreasing trading volume suggest a weakening upward momentum.

Sui price shows signs of weakness

Sui’s price reached a new all-time high of $2.36 on October 13, which began declining over 14% in the next eight days. At the time of writing on Tuesday, it trades slightly down around $2.00.

Moreover, the Relative Strength Index (RSI) and the Awesome Oscillator (AO) indicator support suggest a bearish outlook in the daily chart. The higher high in SUI’s price formed on October 13 does not reflect the RSI lower high for the same period. This development is termed a bearish divergence, often leading to a trend reversal or short-term crash.

If SUI continues its decline, it could crash 18% from its current trading level of $2.00 to retest its 61.8% Fibonacci retracement level (drawn from August’s low of $0.46 to October’s high of $2.36) at $1.64.
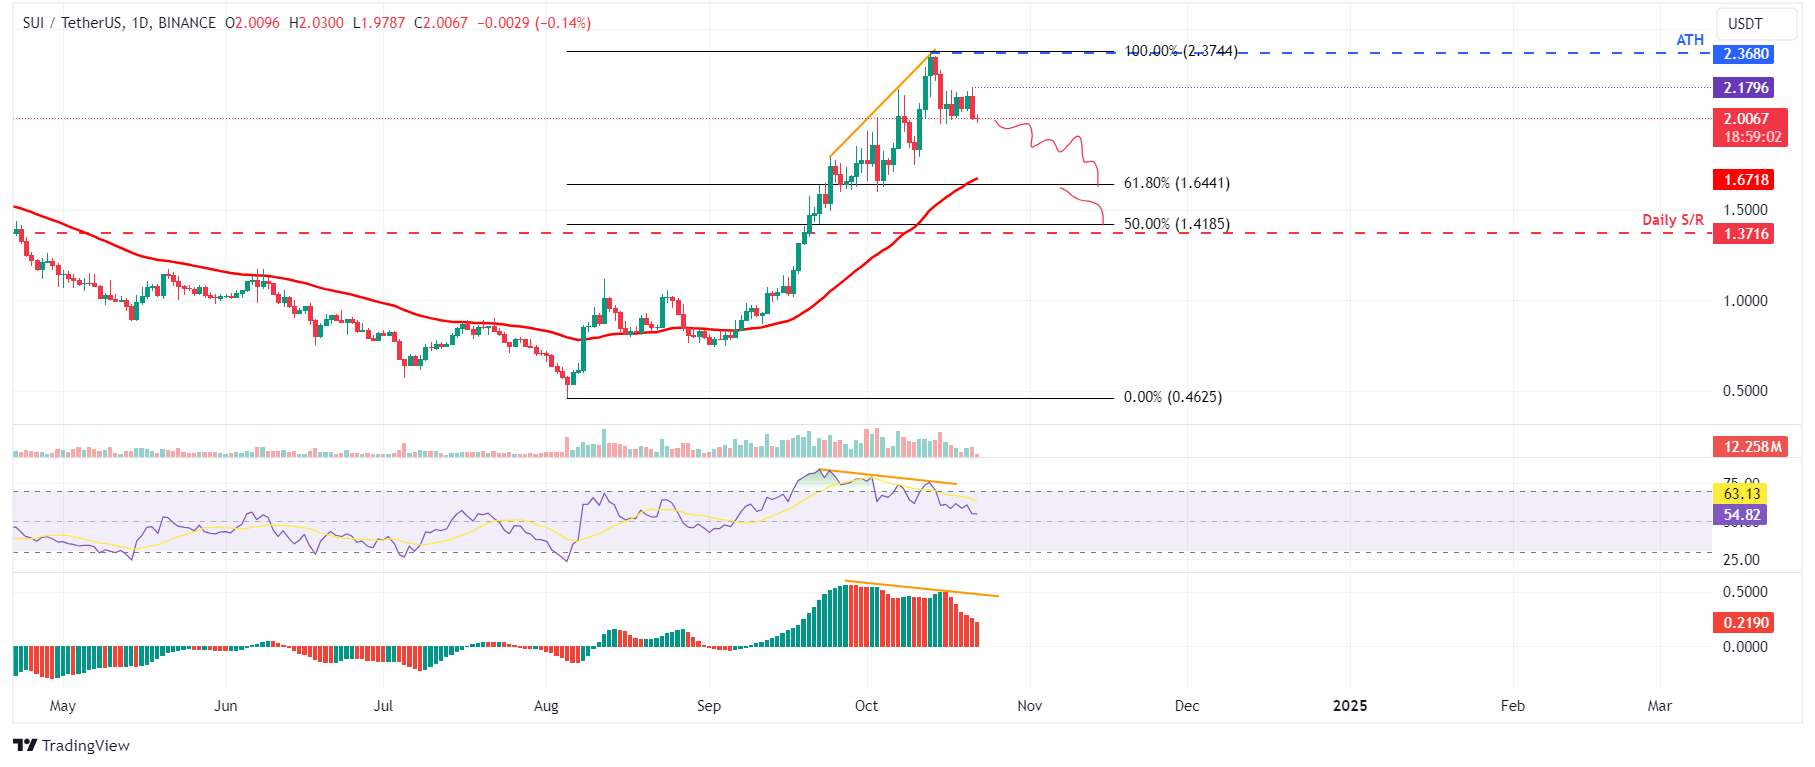
SUI/USDT daily chart

SUI/USDT daily chart

Coinglass’s data also aligns with the bearish outlook. Sui’s long-to-short ratio is 0.866, the lowest level in one month. This ratio reflects bearish sentiment in the market, as the number below one suggests that more traders anticipate the asset’s price to fall.

SUI long-to-short ratio chart. Source: Coinglass

SUI long-to-short ratio chart. Source: Coinglas

Another aspect bolstering the platform’s bearish outlook is a recent decline in traders’ interest and liquidity in the SUI chain. Coinglass data shows that SUI’s daily trading volume declined from  $4.02 billion on October 16 to $1.05 billion on Sunday, consistently declining since early October.

SUI daily trading volume chart. Source: Coinglass

SUI daily trading volume chart. Source: Coinglass

However, the bearish thesis would be invalidated if the Sui price closes above $2.17. This scenario could lead to a rally in Sui’s price to retest its all-time high of $2.36.

ข้อจำกัดความรับผิดชอบ: เพื่อการอ้างอิงเท่านั้น ผลการดำเนินงานในอดีตไม่ได้บ่งบอกถึงผลลัพธ์ในอนาคต
placeholder
การคาดการณ์ราคาหุ้น AAPL: ภายในปี 2566 นี้ จะสามารถกลับคืนสู่มูลค่าตลาด 3 ล้านล้าน ได้หรือไม่?การลดลงของราคาหุ้นของ Apple มีสาเหตุหลักมาจากปัจจัยด้านลบและทัศนคติเชิงลบของนักลงทุนที่มีต่อตลาดโดยรวม คุณค่าที่แท้จริง รวมถึงประสิทธิภาพของผลิตภัณฑ์ และ บริการ Apple จะยังคงเป็นปัจจัยเชิงบวกได้ตลอดทั้งปี 2022 ปัจจัยลบระดับมหภาคที่ส่งผลต่อราคาหุ้น Apple จะค่อยๆ อ่อนตัวลงในปี 2566
ผู้เขียน  Mitrade
วันที่ 08 มิ.ย. 2023
การลดลงของราคาหุ้นของ Apple มีสาเหตุหลักมาจากปัจจัยด้านลบและทัศนคติเชิงลบของนักลงทุนที่มีต่อตลาดโดยรวม คุณค่าที่แท้จริง รวมถึงประสิทธิภาพของผลิตภัณฑ์ และ บริการ Apple จะยังคงเป็นปัจจัยเชิงบวกได้ตลอดทั้งปี 2022 ปัจจัยลบระดับมหภาคที่ส่งผลต่อราคาหุ้น Apple จะค่อยๆ อ่อนตัวลงในปี 2566
placeholder
ราคา XRP มีแนวโน้มสูงขึ้นได้อย่างยั่งยืนทนายความคาดว่าจะสามารถจบคดี Ripple มูลค่า 20 ล้านดอลลาร์ได้ Ripple อาจจ่ายเงินค่าปรับ 20 ล้านดอลลาร์ได้ นี่อาจจะเป็นชัยชนะต่อคณะกรรมการ ก.ล.ต. ตามที่ทนายความ John Deaton ได้กล่าวไว้
ผู้เขียน  Mitrade
วันที่ 09 พ.ย. 2023
Ripple อาจจ่ายเงินค่าปรับ 20 ล้านดอลลาร์ได้ นี่อาจจะเป็นชัยชนะต่อคณะกรรมการ ก.ล.ต. ตามที่ทนายความ John Deaton ได้กล่าวไว้
placeholder
FED จะเริ่มลดอัตราดอกเบี้ยในปี 2024 และคาดว่าทองคำจะก้าวเข้าสู่ระดับสูงสุดเป็นประวัติการณ์ที่ 2,147 ดอลลาร์ขณะนี้ราคาทองคำกำลังแข็งค่าอย่างแข็งแกร่งโดยอยู่ที่ประมาณ 2,050 ดอลลาร์ แนวต้านด้านบนอยู่ที่ 2,090 ดอลลาร์และระดับ 2,110 ดอลลาร์ และแนวรับที่ต่ำกว่าอยู่ที่ 2,010 ดอลลาร์และ 1,980 ดอลลาร์
ผู้เขียน  Mitrade
วันที่ 28 ธ.ค. 2023
ขณะนี้ราคาทองคำกำลังแข็งค่าอย่างแข็งแกร่งโดยอยู่ที่ประมาณ 2,050 ดอลลาร์ แนวต้านด้านบนอยู่ที่ 2,090 ดอลลาร์และระดับ 2,110 ดอลลาร์ และแนวรับที่ต่ำกว่าอยู่ที่ 2,010 ดอลลาร์และ 1,980 ดอลลาร์
placeholder
ราคาน้ำมันดิบขยับขึ้น ตัวเลข API ที่ลดลงเป็นปัจจัยหนุนน้ำมันดิบเบรนท์ฟิวเจอร์ส ซึ่งจะหมดอายุในเดือนธันวาคม เพิ่มขึ้น 0.6% เป็น 74.67 ดอลลาร์ต่อบาร์เรล ในขณะที่ น้ำมันดิบ WTI ฟิวเจอร์ส เพิ่มขึ้น 0.6% เป็น 70.27 ดอลลาร์ต่อบาร์เรล เมื่อ 21:02 ET (01:02 GMT)
ผู้เขียน  Investing.com
10 เดือน 17 วัน พฤหัส
น้ำมันดิบเบรนท์ฟิวเจอร์ส ซึ่งจะหมดอายุในเดือนธันวาคม เพิ่มขึ้น 0.6% เป็น 74.67 ดอลลาร์ต่อบาร์เรล ในขณะที่ น้ำมันดิบ WTI ฟิวเจอร์ส เพิ่มขึ้น 0.6% เป็น 70.27 ดอลลาร์ต่อบาร์เรล เมื่อ 21:02 ET (01:02 GMT)
placeholder
วิเคราะห์ราคา EUR/USD: ซื้อขายเหนือระดับ 1.0850 เข้าใกล้การทะลุออกจากกรอบลาดลงEUR/USD ขยับต่ำลงเข้าใกล้ 1.0860 ในช่วงเซสชั่นเอเชียในวันจันทร์ การรีวิวกราฟรายวันแสดงให้เห็นว่า คู่เงินนี้ได้ทะลุออกจากรูปแบบกราฟกรอบเทรนด์ไลน์ลาดลงแล้ว ซึ่งหากหลุดกลับเข้าสู่กรอบนี้อีกครั้ง ก็อาจตอกย้ำแนวโน้มขาลงของคู่สกุลเงินนี้
ผู้เขียน  FXStreet
เมื่อวาน 09: 52
EUR/USD ขยับต่ำลงเข้าใกล้ 1.0860 ในช่วงเซสชั่นเอเชียในวันจันทร์ การรีวิวกราฟรายวันแสดงให้เห็นว่า คู่เงินนี้ได้ทะลุออกจากรูปแบบกราฟกรอบเทรนด์ไลน์ลาดลงแล้ว ซึ่งหากหลุดกลับเข้าสู่กรอบนี้อีกครั้ง ก็อาจตอกย้ำแนวโน้มขาลงของคู่สกุลเงินนี้
goTop
quote