Tron price is set for a decline as technical indicators show bearish momentum

แหล่งที่มา Fxstreet
  • Tron's RSI indicator forms a bearish divergence, signaling a trend reversal.
  • On-chain data paints a bearish picture, as TRX's long-to-short ratio is below one, and the OI-Weighted Funding rate is negative.
  • A daily candlestick close above $0.170 would invalidate the bearish thesis.


Tron (TRX) retested its resistance barrier and declined 6.1% last week. In the Asian session on Monday, it trades at $0.1557. Tron's price action suggests a decline ahead, as the bearish divergence in technical indicators shows. Furthermore, the on-chain data support the bearish thesis as TRX's long-to-short ratio is below one, and the Oi-Weighted Funding rate is negative.


Tron price is poised for a decline after retesting the resistance barrier


Tron price retested its March 7, 2021, high of $0.170 on August 25  and declined 6.1% last week. On Monday, it trades slightly higher by 0.06% at $0.1557.


Additionally, the formation of a higher high on the daily chart on August 25 contrasts with the Relative Strength Index (RSI) indicator's lower high during the same period. This development is termed a bearish divergence and often leads to the reversal of the trend or a short-term decline.


If the $0.170 level resistance holds, Tron could decline roughly 7% from the current trading level of $0.1557 to retest $0.1425, the previous weekly support.
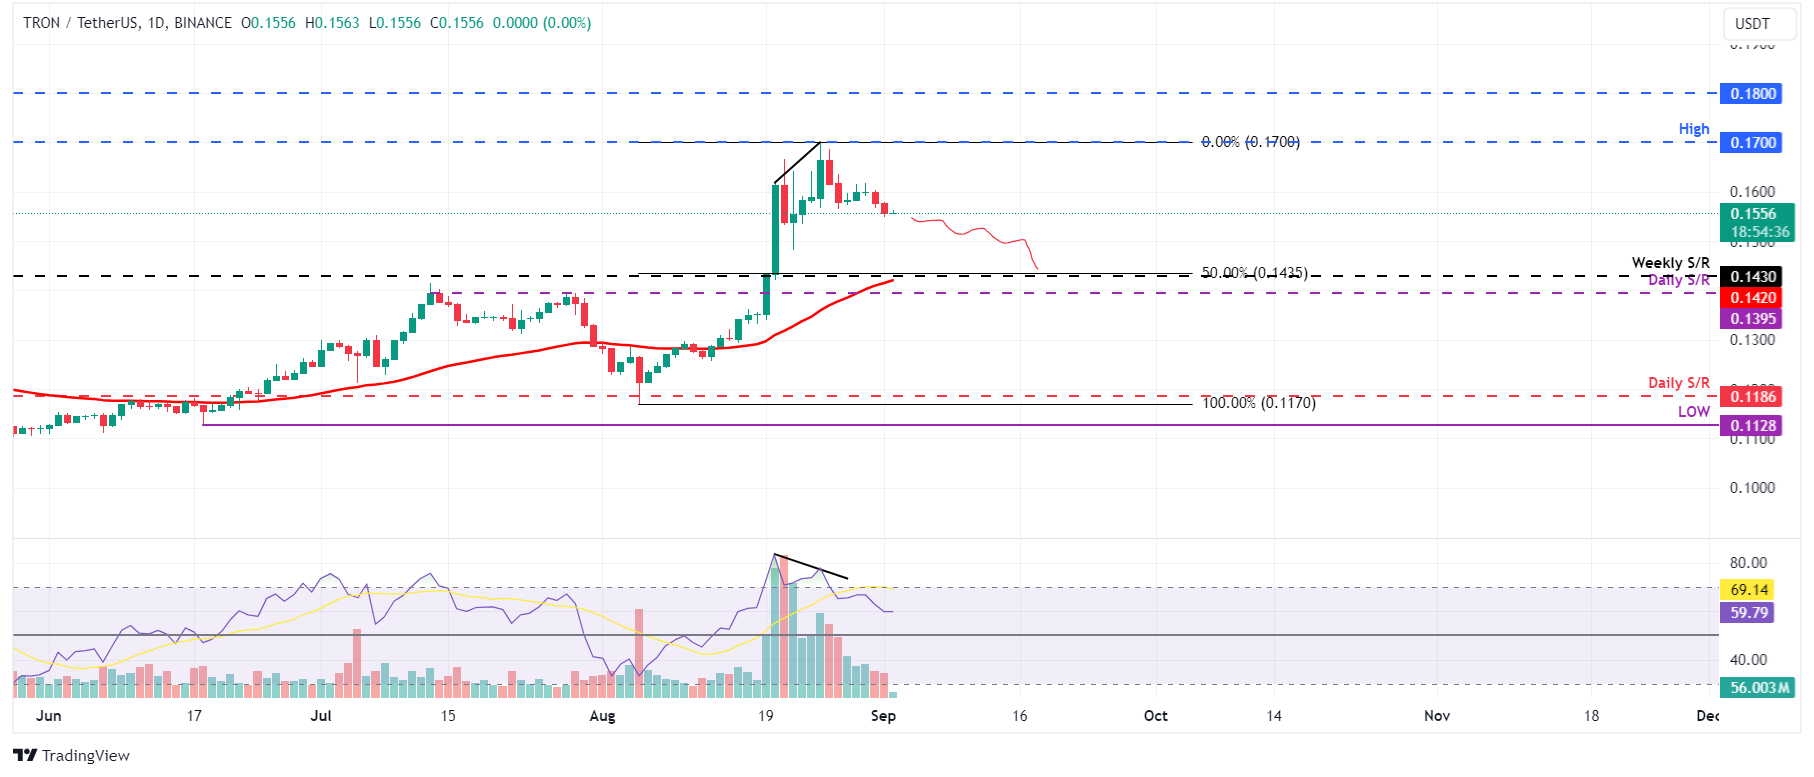
TRX/USDT daily chart

TRX/USDT daily chart


According to Coinglass's OI-Weighted Funding Rate data, it is an important metric for traders and analysts to gauge market sentiment and predict future price movements. This index is based on the yields of futures contracts, which are weighted by their open interest rates. Generally, a positive rate (longs pay shorts) indicates bullish sentiment when long positions pay for shorts. Conversely, negative numbers (shorts pay longs) indicate bearishness, and shorts pay at the expense of longs.


In the case of Tron, this metric stands at -0.033%, reflecting a negative rate and indicating that shorts are paying longs. This scenario often signifies bearish sentiment in the market, suggesting potential downward pressure on Tron's price.

TRX OI-Weighted Funding Rate chart

TRX OI-Weighted Funding Rate chart


Additionally, according to Coinglass's data, Binance TRX's long-to-short ratio stands at 0.43. This ratio reflects bearish sentiment in the market, as the number below one suggests that more traders anticipate the price of the asset to fall, bolstering Tron's bearish outlook.

Tron long-to-short ratio chart

Tron long-to-short ratio chart


However, if TRX's daily candlestick closes above $0.170 and establishes a higher high on the daily timeframe, it may signal a shift in market dynamics that favors bullish sentiment. Such a change could nullify the bearish outlook, leading to a 6% rise in Tron's price to retest the April 17, 2021, high at $0.180.

ข้อจำกัดความรับผิดชอบ: เพื่อการอ้างอิงเท่านั้น ผลการดำเนินงานในอดีตไม่ได้บ่งบอกถึงผลลัพธ์ในอนาคต
placeholder
หุ้น AMD ลดลง 5% จากอันดับเครดิตที่ลดลงของนักวิเคราะห์Advanced Micro Devices (AMD) ถูกลดระดับจาก "ซื้อ" เป็น "ลด" และราคาเป้าหมายก็ลดลงจาก 200 ดอลลาร์เหลือ 110 ดอลลาร์หรือเกือบครึ่งหนึ่งโดยนักวิเคราะห์ของ HSBC ในวันพุธ หุ้น AMD ร่วง 5% เนื่องจากการปรับลด HSBC นักวิเคราะห์กล่าวว่าการตรวจสอบล่าสุดมีความจำเป็นเนื่องจากความกังวลเกี่ยวกับความสามารถของบริษัทในการแข่งขัน […]
ผู้เขียน  Cryptopolitan
1 เดือน 09 วัน พฤหัส
Advanced Micro Devices (AMD) ถูกลดระดับจาก "ซื้อ" เป็น "ลด" และราคาเป้าหมายก็ลดลงจาก 200 ดอลลาร์เหลือ 110 ดอลลาร์หรือเกือบครึ่งหนึ่งโดยนักวิเคราะห์ของ HSBC ในวันพุธ หุ้น AMD ร่วง 5% เนื่องจากการปรับลด HSBC นักวิเคราะห์กล่าวว่าการตรวจสอบล่าสุดมีความจำเป็นเนื่องจากความกังวลเกี่ยวกับความสามารถของบริษัทในการแข่งขัน […]
placeholder
WTI เคลื่อนไหวอยู่ราว $77.00 แตะระดับสูงสุดในรอบสามเดือนหลังจากสหรัฐฯ คว่ำบาตรน้ำมันรัสเซียราคาน้ำมัน West Texas Intermediate (WTI) ขยายตัวเพิ่มขึ้นเป็นวันที่สามติดต่อกัน เคลื่อนไหวอยู่ที่ประมาณ 77.00 ดอลลาร์ต่อบาร์เรล ใกล้ระดับ 77.46 ดอลลาร์ ซึ่งเป็นระดับที่ไม่เคยเห็นมาตั้งแต่วันที่ 8 ตุลาคม ในช่วงเวลาการซื้อขายของเอเชียในวันจันทร์
ผู้เขียน  FXStreet
1 เดือน 13 วัน จันทร์
ราคาน้ำมัน West Texas Intermediate (WTI) ขยายตัวเพิ่มขึ้นเป็นวันที่สามติดต่อกัน เคลื่อนไหวอยู่ที่ประมาณ 77.00 ดอลลาร์ต่อบาร์เรล ใกล้ระดับ 77.46 ดอลลาร์ ซึ่งเป็นระดับที่ไม่เคยเห็นมาตั้งแต่วันที่ 8 ตุลาคม ในช่วงเวลาการซื้อขายของเอเชียในวันจันทร์
placeholder
GBP/JPY ยังคงอยู่เหนือระดับ 192.00 เนื่องจากได้รับการสนับสนุนจากความเชื่อมั่นในความเสี่ยงGBP/JPY หยุดการลดลงต่อเนื่องห้าวันเนื่องจากปอนด์สเตอร์ลิง (GBP) แข็งค่าขึ้น โดยได้รับแรงหนุนจากความเชื่อมั่นของนักลงทุนที่ดีขึ้นหลังจากมีรายงานว่าทีมเศรษฐกิจของประธานาธิบดีสหรัฐฯ ที่ได้รับเลือก โดนัลด์ ทรัมป์ กำลังพิจารณาการเพิ่มภาษีนำเข้าอย่างค่อยเป็นค่อยไป
ผู้เขียน  FXStreet
19 ชั่วโมงที่แล้ว
GBP/JPY หยุดการลดลงต่อเนื่องห้าวันเนื่องจากปอนด์สเตอร์ลิง (GBP) แข็งค่าขึ้น โดยได้รับแรงหนุนจากความเชื่อมั่นของนักลงทุนที่ดีขึ้นหลังจากมีรายงานว่าทีมเศรษฐกิจของประธานาธิบดีสหรัฐฯ ที่ได้รับเลือก โดนัลด์ ทรัมป์ กำลังพิจารณาการเพิ่มภาษีนำเข้าอย่างค่อยเป็นค่อยไป
placeholder
USD/JPY พุ่งขึ้นอย่างรวดเร็วใกล้ 158.00 ความน่าสนใจในฐานะสินทรัพย์ปลอดภัยของเงินเยนอ่อนลงในตลาดลงทุนยุโรปวันอังคาร คู่ USD/JPY ปรับตัวขึ้นอย่างรวดเร็วไปใกล้ระดับ 158.00
ผู้เขียน  FXStreet
17 ชั่วโมงที่แล้ว
ในตลาดลงทุนยุโรปวันอังคาร คู่ USD/JPY ปรับตัวขึ้นอย่างรวดเร็วไปใกล้ระดับ 158.00
placeholder
ราคาทองคำปรับตัวขึ้นจากความหวังใหม่ของนักลงทุนเกี่ยวกับการผ่อนคลราคาทองคำปรับตัวสูงขึ้นในวันอังคารหลังจากข้อมูลจากสหรัฐอเมริกา (US) แสดงให้เห็นว่าราคาที่จ่ายโดยผู้ผลิตลดลง
ผู้เขียน  FXStreet
2 ชั่วโมงที่แล้ว
ราคาทองคำปรับตัวสูงขึ้นในวันอังคารหลังจากข้อมูลจากสหรัฐอเมริกา (US) แสดงให้เห็นว่าราคาที่จ่ายโดยผู้ผลิตลดลง
ตราสารที่เกี่ยวข้อง
goTop
quote