Dogecoin price is set for a downturn as it encounters its resistance barrier

แหล่งที่มา Fxstreet
  • Dogecoin price is testing the resistance around the 100-day EMA at $0.1073, with an impending decline ahead.
  • On-chain data shows DOGE's daily active addresses decreasing and dormant wallets moving again, signaling a bearish move.
  • A weekly candlestick close above $0.1073 would invalidate the bearish thesis.


Dogecoin (DOGE) price rose slightly during Asian trading hours on Friday, approaching the critical resistance zone around $0.1073. On-chain data shows DOGE's daily active addresses decreasing and dormant wallets moving again, signaling a bearish outlook for Dogecoin in the upcoming days.


Dogecoin price poised for rejection after retesting key resistance level

Dogecoin's price finds resistance around its 100-day Exponential Moving Average (EMA), which is around $0.1073. This level also aligns with the weekly resistance level of $0.1018. As of Friday, it trades slightly higher by 1% at $0.1010.


If the 100-day EMA at $0.1073 holds as resistance, DOGE could decline 24% to retest its next weekly support at $0.0782.

The Relative Strength Index (RSI) and the Awesome Oscillator (AO) on the weekly chart trade below their neutral levels of 50 and zero, respectively, suggesting an impending bearish trend.
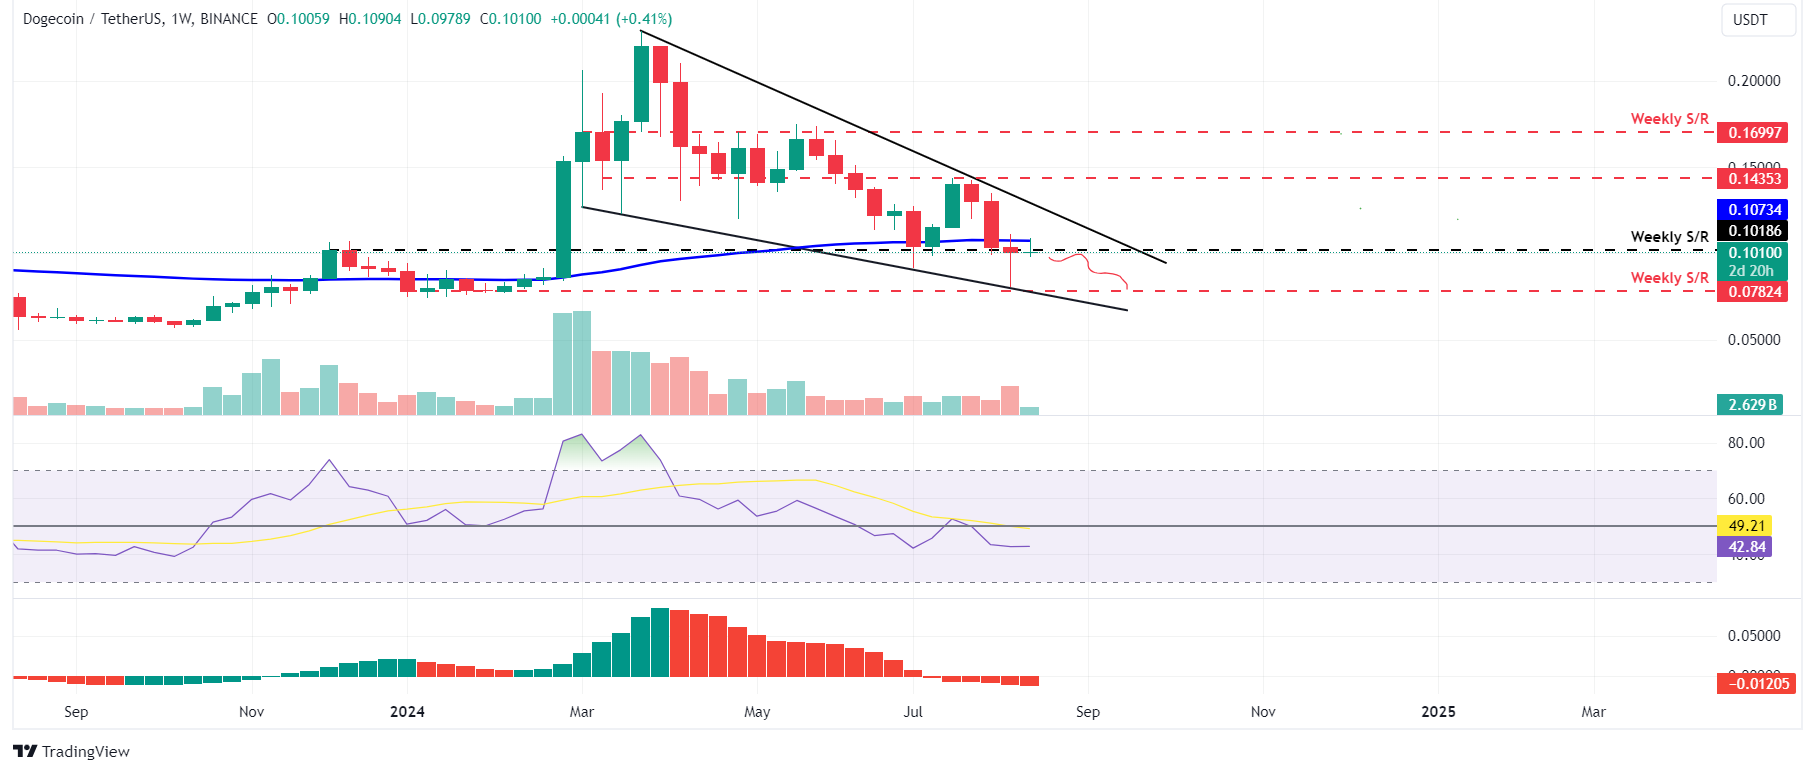
DOGE/USDT weekly chart

DOGE/USDT weekly chart

Santiment's Daily Active Addresses index, which helps track network activity over time, aligns with the bearish outlook noted from a technical perspective. A rise in the metric signals greater blockchain usage, while declining addresses point to lower demand for the network.


In Doge's case, Daily Active Addresses have declined 10% this week and have been falling constantly since mid-March, indicating demand for DOGE's blockchain usage is decreasing.

DOGE Daily Active Addresses chart

DOGE Daily Active Addresses chart

Additionally, Santiment's Age Consumed index shows that spikes in this metric suggest dormant tokens (tokens stored in wallets for a long time) are in motion and can be used to spot short-term local tops or bottoms.


For DOGE, history shows that the spikes were followed by a decline in Dogecoin price. The most recent uptick on August 6 also forecasted that DOGE was ready for a downtrend.

DOGE Age Consumed chart

DOGE Age Consumed chart

Even though on-chain metrics and technical analysis point to a bearish outlook, if the Dogecoin price produces a weekly candlestick close above $0.1073, the move would invalidate the bearish thesis. This development could see DOGE's price rally to revisit its weekly resistance at $0.1435.

ข้อจำกัดความรับผิดชอบ: เพื่อการอ้างอิงเท่านั้น ผลการดำเนินงานในอดีตไม่ได้บ่งบอกถึงผลลัพธ์ในอนาคต
placeholder
การคาดการณ์ราคาหุ้น AAPL: ภายในปี 2566 นี้ จะสามารถกลับคืนสู่มูลค่าตลาด 3 ล้านล้าน ได้หรือไม่?การลดลงของราคาหุ้นของ Apple มีสาเหตุหลักมาจากปัจจัยด้านลบและทัศนคติเชิงลบของนักลงทุนที่มีต่อตลาดโดยรวม คุณค่าที่แท้จริง รวมถึงประสิทธิภาพของผลิตภัณฑ์ และ บริการ Apple จะยังคงเป็นปัจจัยเชิงบวกได้ตลอดทั้งปี 2022 ปัจจัยลบระดับมหภาคที่ส่งผลต่อราคาหุ้น Apple จะค่อยๆ อ่อนตัวลงในปี 2566
ผู้เขียน  Mitrade
วันที่ 08 มิ.ย. 2023
การลดลงของราคาหุ้นของ Apple มีสาเหตุหลักมาจากปัจจัยด้านลบและทัศนคติเชิงลบของนักลงทุนที่มีต่อตลาดโดยรวม คุณค่าที่แท้จริง รวมถึงประสิทธิภาพของผลิตภัณฑ์ และ บริการ Apple จะยังคงเป็นปัจจัยเชิงบวกได้ตลอดทั้งปี 2022 ปัจจัยลบระดับมหภาคที่ส่งผลต่อราคาหุ้น Apple จะค่อยๆ อ่อนตัวลงในปี 2566
placeholder
FED จะเริ่มลดอัตราดอกเบี้ยในปี 2024 และคาดว่าทองคำจะก้าวเข้าสู่ระดับสูงสุดเป็นประวัติการณ์ที่ 2,147 ดอลลาร์ขณะนี้ราคาทองคำกำลังแข็งค่าอย่างแข็งแกร่งโดยอยู่ที่ประมาณ 2,050 ดอลลาร์ แนวต้านด้านบนอยู่ที่ 2,090 ดอลลาร์และระดับ 2,110 ดอลลาร์ และแนวรับที่ต่ำกว่าอยู่ที่ 2,010 ดอลลาร์และ 1,980 ดอลลาร์
ผู้เขียน  Mitrade
วันที่ 28 ธ.ค. 2023
ขณะนี้ราคาทองคำกำลังแข็งค่าอย่างแข็งแกร่งโดยอยู่ที่ประมาณ 2,050 ดอลลาร์ แนวต้านด้านบนอยู่ที่ 2,090 ดอลลาร์และระดับ 2,110 ดอลลาร์ และแนวรับที่ต่ำกว่าอยู่ที่ 2,010 ดอลลาร์และ 1,980 ดอลลาร์
placeholder
ราคาน้ำมันดิบขยับขึ้น ตัวเลข API ที่ลดลงเป็นปัจจัยหนุนน้ำมันดิบเบรนท์ฟิวเจอร์ส ซึ่งจะหมดอายุในเดือนธันวาคม เพิ่มขึ้น 0.6% เป็น 74.67 ดอลลาร์ต่อบาร์เรล ในขณะที่ น้ำมันดิบ WTI ฟิวเจอร์ส เพิ่มขึ้น 0.6% เป็น 70.27 ดอลลาร์ต่อบาร์เรล เมื่อ 21:02 ET (01:02 GMT)
ผู้เขียน  Investing.com
10 เดือน 17 วัน พฤหัส
น้ำมันดิบเบรนท์ฟิวเจอร์ส ซึ่งจะหมดอายุในเดือนธันวาคม เพิ่มขึ้น 0.6% เป็น 74.67 ดอลลาร์ต่อบาร์เรล ในขณะที่ น้ำมันดิบ WTI ฟิวเจอร์ส เพิ่มขึ้น 0.6% เป็น 70.27 ดอลลาร์ต่อบาร์เรล เมื่อ 21:02 ET (01:02 GMT)
placeholder
ทองคำพุ่งแตะ $2,700 จากความไม่แน่นอนในการเลือกตั้งและแนวโน้มอัตราดอกเบี้ยInvesting.com - ราคาทองคำพุ่งแตะระดับสูงสุดเป็นประวัติการณ์ในตลาดเอเชียวันนี้ หลังได้รับประโยชน์จากความต้องการสินทรัพย์ปลอดภัย เนื่องจากเหลือเวลาเพียงไม่กี่สัปดาห์ก่อนการเลือกตั้งประธานาธิบดีของสหรัฐฯ
ผู้เขียน  Investing.com
10 เดือน 18 วัน ศุกร์
Investing.com - ราคาทองคำพุ่งแตะระดับสูงสุดเป็นประวัติการณ์ในตลาดเอเชียวันนี้ หลังได้รับประโยชน์จากความต้องการสินทรัพย์ปลอดภัย เนื่องจากเหลือเวลาเพียงไม่กี่สัปดาห์ก่อนการเลือกตั้งประธานาธิบดีของสหรัฐฯ
placeholder
วิเคราะห์ราคา EUR/USD: ซื้อขายเหนือระดับ 1.0850 เข้าใกล้การทะลุออกจากกรอบลาดลงEUR/USD ขยับต่ำลงเข้าใกล้ 1.0860 ในช่วงเซสชั่นเอเชียในวันจันทร์ การรีวิวกราฟรายวันแสดงให้เห็นว่า คู่เงินนี้ได้ทะลุออกจากรูปแบบกราฟกรอบเทรนด์ไลน์ลาดลงแล้ว ซึ่งหากหลุดกลับเข้าสู่กรอบนี้อีกครั้ง ก็อาจตอกย้ำแนวโน้มขาลงของคู่สกุลเงินนี้
ผู้เขียน  FXStreet
เมื่อวาน 09: 52
EUR/USD ขยับต่ำลงเข้าใกล้ 1.0860 ในช่วงเซสชั่นเอเชียในวันจันทร์ การรีวิวกราฟรายวันแสดงให้เห็นว่า คู่เงินนี้ได้ทะลุออกจากรูปแบบกราฟกรอบเทรนด์ไลน์ลาดลงแล้ว ซึ่งหากหลุดกลับเข้าสู่กรอบนี้อีกครั้ง ก็อาจตอกย้ำแนวโน้มขาลงของคู่สกุลเงินนี้
ตราสารที่เกี่ยวข้อง
goTop
quote