
Billionaire Mark Cuban highlights Silicon Valley's increasing support for former President Trump as a “Bitcoin Play”
- Billionaire investor Mark Cuban discussed on Twitter about Silicon Valley's growing support for former President Trump, labeling it a "bitcoin play."
- On-chain data shows that BTC's short-term holders are increasing their holdings.
- US spot Bitcoin ETFs record third-day inflows this week.
Bitcoin (BTC) faces resistance and stalls at around the $65,000 mark on Thursday, while on-chain data indicate a rise in holdings among short-term investors, coupled with a slight increase in inflows at US spot Bitcoin ETFs. Additionally, billionaire investor Mark Cuban highlighted Silicon Valley's increasing backing of former President Trump as a strategic move tied to Bitcoin, discussed on Twitter.
Daily digest market movers: Emergent support for former President Trump, a Bitcoin play
- Billionaire investor Mark Cuban shared on Twitter about Silicon Valley's growing backing for former President Trump, labeling it a "bitcoin play" on Wednesday.
- Cuban said, "Not because the former President is a far stronger proponent of crypto. That's nice. But doesn't really impact the price of crypto. It makes it easier to operate a crypto business because of the inevitable, and required, changes at the SEC."
- He also wrote, "What will drive the price of BTC is lower tax rates and tariffs, which, if history is any guide (and it's not always ), will be inflationary. Combine that with global uncertainty as to the geopolitical role of the USA, and the impact on the U.S. Dollar as a reserve currency, and you can't align the stars any better for a BTC price acceleration."
- In the second part of the tweet, Cuban explained how high Bitcoin price can go as its supply is limited to 21 million coins, with unlimited fractionalization. He added, "Keep that in mind as you consider what happens if, because of geopolitical uncertainty and the decline of the dollar as the reserve currency, BTC becomes a "safe haven" globally. Which means that BTC could be what countries and all of us look to buy as a means to protect our savings".
- While he stops short of making a definitive prediction, he acknowledges a non-zero probability or "a possibility somewhere above zero" that Bitcoin could transform into a global currency, aligning with the aspirations of its staunchest proponents.
Part 1
— Mark Cuban (@mcuban) July 17, 2024
Here is a contrary opinion on the emergence of Silicon Valley support for former President Trump. Which like all my opinions on here, probably won’t be popular.
It’s a bitcoin play.
Not because the former President is a far stronger proponent of crypto. That’s nice.…
- According to CryptoQuant, the Bitcoin Short-Term Holder (STH) Realized Price metric reflects the average acquisition cost of Bitcoin for investors holding the cryptocurrency for less than 155 days. Illustrated in the chart below, red bars indicate periods when Bitcoin's price is below this metric, while green bars show when it exceeds it.
- Recently, Bitcoin has risen above the STH Realized Price, a positive indicator as short-term holders typically increase their holdings at this level, establishing support. Since 2023, Bitcoin has surpassed this metric twice, resulting in profits of at least 30% each time.
-638568873353785845.png)
Bitcoin Short-Term Holder (STH) Realized Price chart
- According to Lookonchain, a buyer acquired 215.5 BTC, valued at $14 million, on Thursday, following a purchase of 245 BTC, valued at $15.98 million, the day before. The wallet now holds a total of 465.16 BTC, valued at approximately $30 million.
This smart money bought 215.5 $BTC($14M) again 16 minutes ago and currently holds 463.16 $BTC($30M).https://t.co/jovITZeHNy pic.twitter.com/HZeFgUzQ6I
— Lookonchain (@lookonchain) July 18, 2024
- According to Coinglass Bitcoin Spot ETF data, there were slight inflows of $53.30 million on Wednesday. This marks the third consecutive day of inflows this week. Monitoring these ETFs' net inflow data is crucial for understanding market dynamics and investor sentiment. The combined Bitcoin reserves held by the 11 US spot Bitcoin ETFs stand at $52.22 billion.
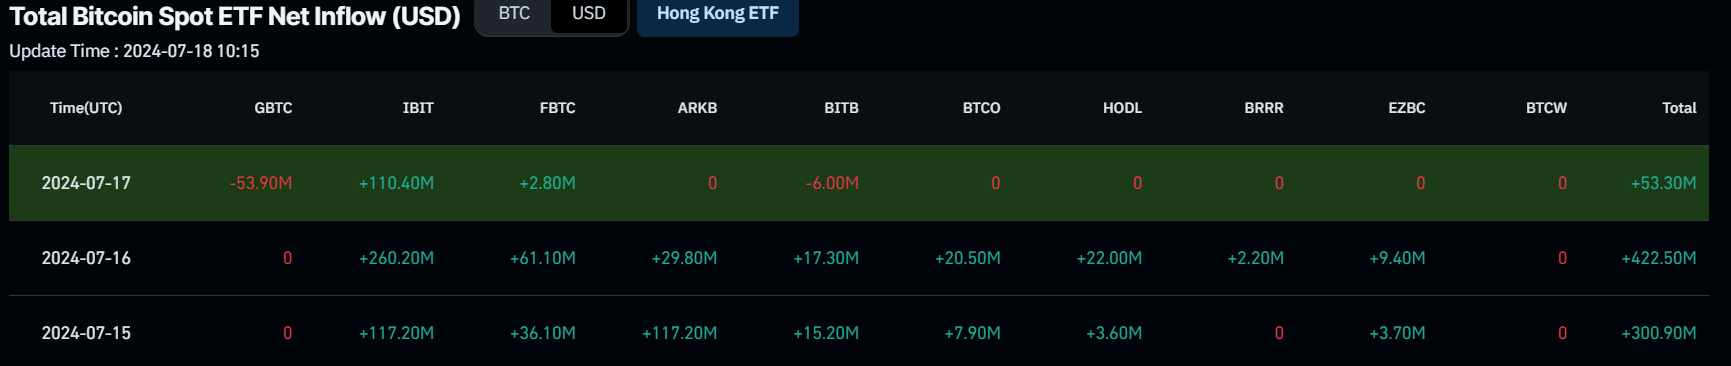
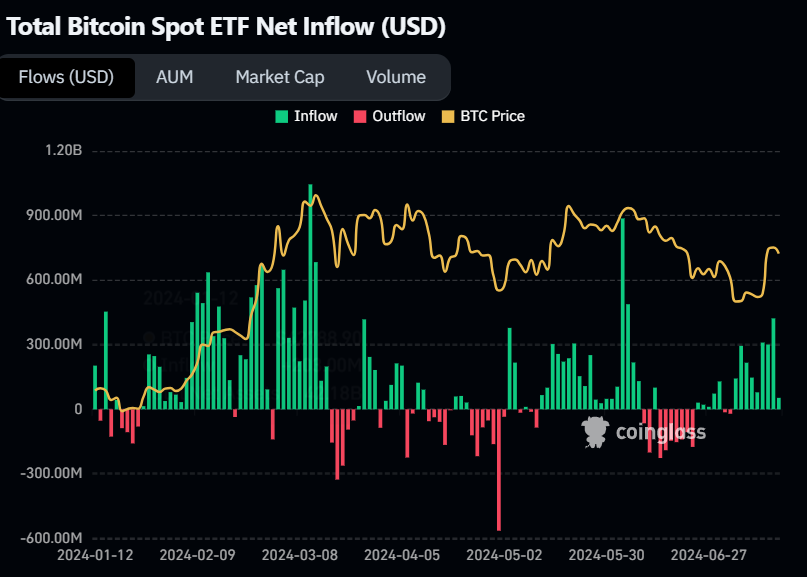
Bitcoin Spot ETF Net Inflow (USD) inflow chart
Technical analysis: BTC price faces resistance by the daily level around $65,000
Bitcoin price faces rejection around the daily resistance level of around $65,000. At the time of writing, it trades slightly up 0.75% at $64,720 on Thursday.
If BTC faces a price pullback, sideline buyers seeking opportunities can consider positions between the $59,200 and $57,800 levels, where the previously broken trendline resistance now serves as support.
However, should BTC sustain its bullish momentum and close above $65,000, it may advance by 4% from its current trading price of $64,720 to test the weekly resistance of around $67,209.
On the daily chart, the Relative Strength Index (RSI) is currently above the neutral level of 50, and the Awesome Oscillator (A.O.) has also flipped above its neutral level of zero. These momentum indicators strongly show bullish dominance.
Furthermore, surpassing the $67,209 level could allow an additional 7% rise to retest its daily high of $71,997 from June 7.
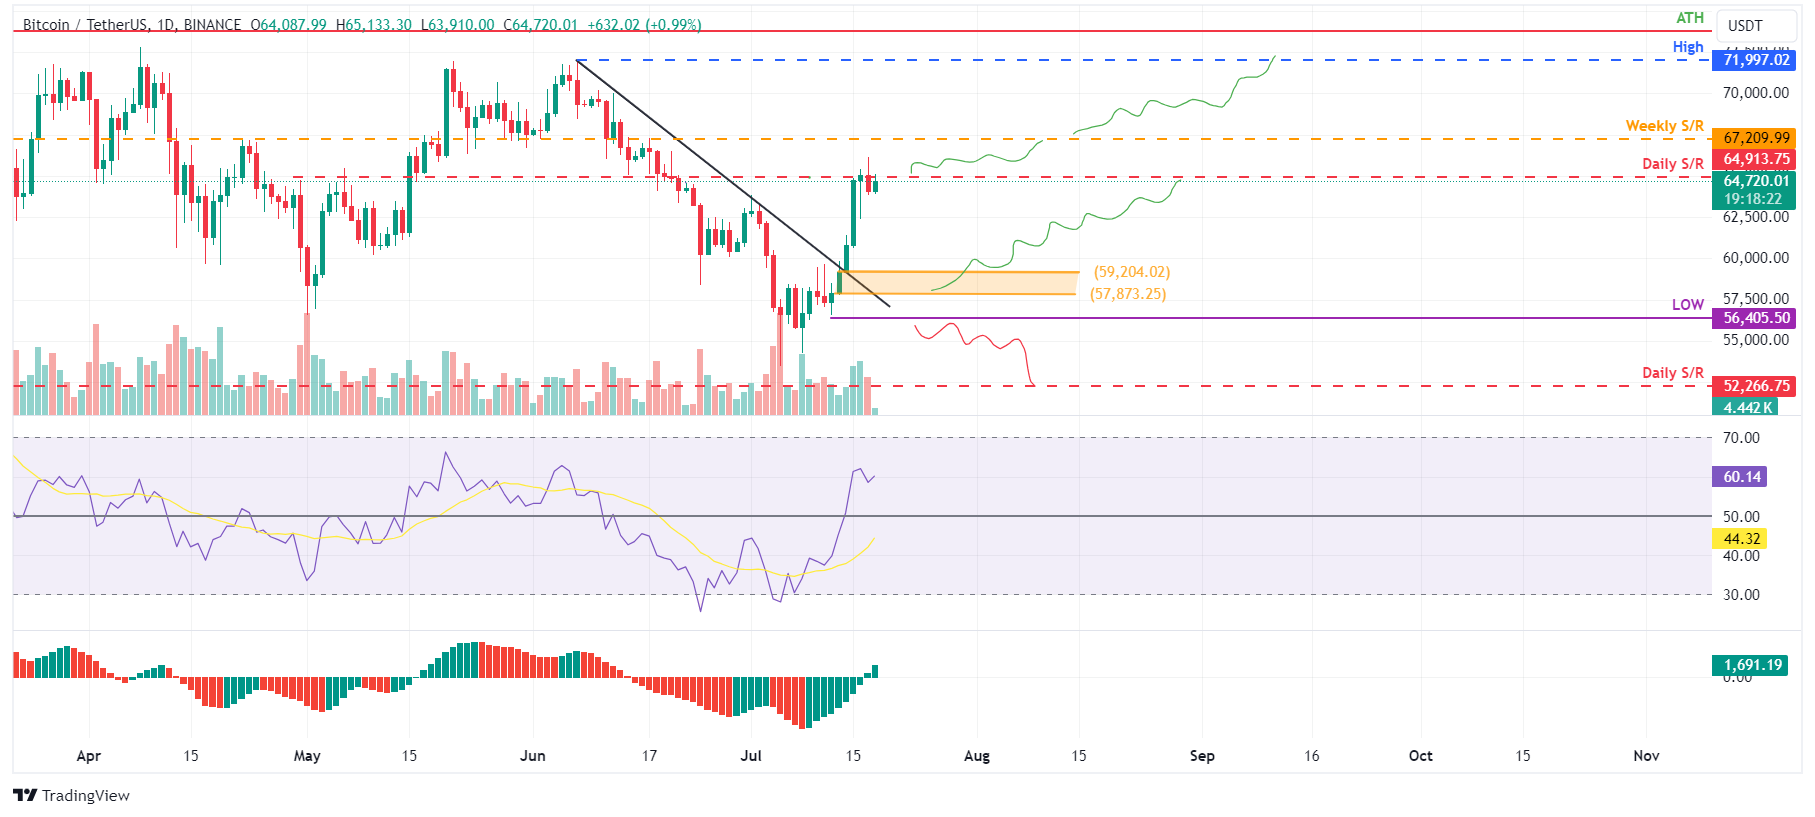
BTC/USDT daily chart
On the other hand, if BTC closes below $56,405 and forms a lower low in the daily timeframe, it may signal persistent bearish sentiment. This scenario could trigger a 7.5% decline in Bitcoin's price, targeting the daily support at $52,266.
Bitcoin, altcoins, stablecoins FAQs
Bitcoin is the largest cryptocurrency by market capitalization, a virtual currency designed to serve as money. This form of payment cannot be controlled by any one person, group, or entity, which eliminates the need for third-party participation during financial transactions.
Altcoins are any cryptocurrency apart from Bitcoin, but some also regard Ethereum as a non-altcoin because it is from these two cryptocurrencies that forking happens. If this is true, then Litecoin is the first altcoin, forked from the Bitcoin protocol and, therefore, an “improved” version of it.
Stablecoins are cryptocurrencies designed to have a stable price, with their value backed by a reserve of the asset it represents. To achieve this, the value of any one stablecoin is pegged to a commodity or financial instrument, such as the US Dollar (USD), with its supply regulated by an algorithm or demand. The main goal of stablecoins is to provide an on/off-ramp for investors willing to trade and invest in cryptocurrencies. Stablecoins also allow investors to store value since cryptocurrencies, in general, are subject to volatility.
Bitcoin dominance is the ratio of Bitcoin's market capitalization to the total market capitalization of all cryptocurrencies combined. It provides a clear picture of Bitcoin’s interest among investors. A high BTC dominance typically happens before and during a bull run, in which investors resort to investing in relatively stable and high market capitalization cryptocurrency like Bitcoin. A drop in BTC dominance usually means that investors are moving their capital and/or profits to altcoins in a quest for higher returns, which usually triggers an explosion of altcoin rallies.
บทความแนะนำ


