


Bitcoin price finds hurdle around the $58,500 level
- The German Government transferred another 1,000 BTC, valued at $55.8 million, on Monday.
- On-chain data shows that liquidations on Defi platforms exceed $17.94 million.
- Bitcoin Exchange netflow records the highest outflow of 68,498 BTC since November 23, 2023.
Bitcoin (BTC) struggles against resistance near the $58,500 level but still trades up 2.93% at $57,515 on Monday. On-chain data shows that liquidations on Defi platforms exceed $17.94 million, and Exchange netflow records the highest outflow of 68,498 BTC since November 23, 2023. Meanwhile, the German Government transferred an additional 1,000 BTC, valued at $55.8 million, on the same day.
Daily digest market movers: Bitcoin marked the highest Exchange outflow in 2024
- According to data from Lookonchain, the German Government transferred 1,000 BTC, valued at $55.8 million, from its wallet on Monday. Of this, 500 BTC, worth $27.9 million, were transferred to Coinbase and Bitstamp.
- Since June 19, the German Government has transferred 13,466 BTC, equivalent to $819.3 million, while still holding 39,826 $BTC valued at $2.29 billion. This notable transfer activity has potentially contributed to FUD (Fear, Uncertainty, Doubt) among traders, likely influencing Bitcoin's recent decline in price over the past few weeks.
The #German government transferred 1,000 $BTC($55.8M) out again 15 minutes ago, of which 500 $BTC($27.9M) was deposited to #Coinbase and #Bitstamp.
— Lookonchain (@lookonchain) July 8, 2024
The #German government currently holds 38,826 $BTC($2.17B).https://t.co/h2JlBVFPsL pic.twitter.com/NS5pkMixrj
- According to CryptoQuant data, Bitcoin Exchange netflow is the difference between BTC flowing into and out of the exchange (Inflow -outflow = netflow).
- On Friday, Bitcoin recorded a negative netflow of 68,498 BTC, the highest since November 23, 2023. This surge in outflows, prominently visible on the chart below, indicates a significant movement of Bitcoin away from exchanges, a trend often perceived as bullish by investors. The prevailing sentiment is that major holders are transferring their Bitcoin to wallets, possibly signaling expectations of price increases or a preference for long-term holding rather than immediate selling.
 - All Exchanges (1)-638560366321467169.png)
Bitcoin Exchange Netflow chart
- According to data from Santiment's Defi liquidations on Aave and Compound Finance, the recent BTC price drop from a July 4 peak of $60,498 to a July 5 low of $53,485 resulted in over $17.94 million in liquidations on Defi platforms. Historically, such liquidation spikes are typically followed by market recoveries driven by forced selling and strategic purchasing by key stakeholders.
 [15.01.15, 08 Jul, 2024]-638560366785461522.png)
Santiment Defi Liquidation chart
Technical analysis: BTC faces resistance around $58,500 level
Bitcoin's price encountered resistance at the weekly resistance level of $58,375 on Saturday, resulting in a 4% decline the next day. By Sunday's close, it had fallen below the May 1 low of $56,552 and trades around $57,515, 2.93% up on Monday.
If BTC's weekly level at $58,375 acts as resistance, it could decline 5% to revisit the daily support at $52,266.
The Relative Strength Index (RSI) and the Awesome Oscillator (AO) on the daily chart support this bearish thesis, as both indicators are below their respective neutral levels of 50 and zero.
This suggests continued momentum favoring bears, potentially leading to a further decline in the Bitcoin price.
Additionally, if the bears are aggressive and the overall crypto market outlook is negative, BTC could extend an additional decline of 3.3% to retest its February 23 low of $50,521.
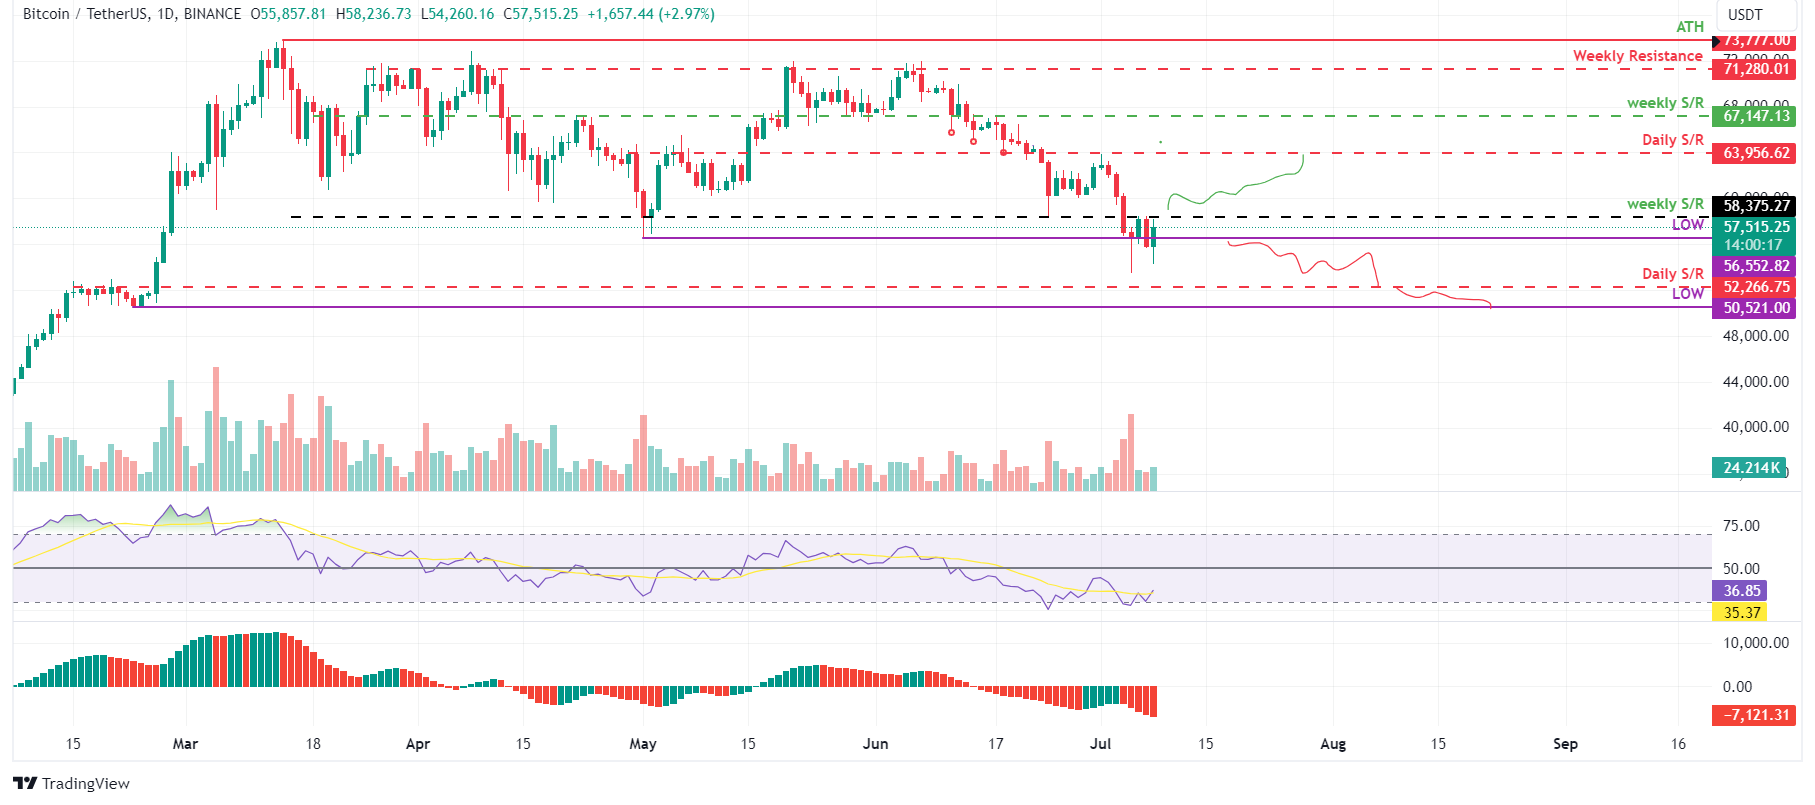
BTC/USDT daily chart
However, if BTC closes above the $58,375 weekly resistance level and forms a higher high in the daily time frame, it could indicate that bullish sentiment persists. Such a development may trigger a 9.7% rise in Bitcoin's price to revisit its next daily resistance at $63,956.
Bitcoin, altcoins, stablecoins FAQs
Bitcoin is the largest cryptocurrency by market capitalization, a virtual currency designed to serve as money. This form of payment cannot be controlled by any one person, group, or entity, which eliminates the need for third-party participation during financial transactions.
Altcoins are any cryptocurrency apart from Bitcoin, but some also regard Ethereum as a non-altcoin because it is from these two cryptocurrencies that forking happens. If this is true, then Litecoin is the first altcoin, forked from the Bitcoin protocol and, therefore, an “improved” version of it.
Stablecoins are cryptocurrencies designed to have a stable price, with their value backed by a reserve of the asset it represents. To achieve this, the value of any one stablecoin is pegged to a commodity or financial instrument, such as the US Dollar (USD), with its supply regulated by an algorithm or demand. The main goal of stablecoins is to provide an on/off-ramp for investors willing to trade and invest in cryptocurrencies. Stablecoins also allow investors to store value since cryptocurrencies, in general, are subject to volatility.
Bitcoin dominance is the ratio of Bitcoin's market capitalization to the total market capitalization of all cryptocurrencies combined. It provides a clear picture of Bitcoin’s interest among investors. A high BTC dominance typically happens before and during a bull run, in which investors resort to investing in relatively stable and high market capitalization cryptocurrency like Bitcoin. A drop in BTC dominance usually means that investors are moving their capital and/or profits to altcoins in a quest for higher returns, which usually triggers an explosion of altcoin rallies.
บทความแนะนำ


