
Australian Dollar remains firm after release of China’s Q1 GDP data
- The Australian Dollar holds steady despite the release of a softer Westpac Leading Index on Wednesday.
- China's GDP grew by 5.4% YoY in Q1, surpassing the expected 5.1% and maintaining a steady pace of expansion.
- The US Dollar remains muted ahead of the release of March Retail Sales data later in the day.
The Australian Dollar (AUD) extends its winning streak against the US Dollar (USD) for a sixth consecutive session on Wednesday, with the AUD/USD pair holding firm after the release of Australia’s Westpac Leading Index. The index’s six-month annualised growth rate, which forecasts economic momentum relative to the trend over the next three to nine months, eased to 0.6% in March from 0.9% in February.
China’s economy grew at an annual rate of 5.4% in the first quarter of 2025, matching the pace seen in Q4 2024 and surpassing market expectations of 5.1%. On a quarterly basis, GDP rose by 1.2% in Q1, following a 1.6% increase in the previous quarter, falling short of the forecasted 1.4% gain.
Meanwhile, China’s Retail Sales surged 5.9% year-over-year, beating expectations of 4.2% and up from February’s 4%. Industrial Production also outperformed, rising 7.7% compared to the 5.6% forecast and February’s 5.9% print.
The AUD also drew support from improved global risk sentiment after US President Donald Trump excluded key technology products from newly proposed “reciprocal” tariffs. The exemptions—covering smartphones, computers, semiconductors, solar cells, and flat-panel displays—largely apply to goods manufactured in China, Australia’s largest trading partner and a key buyer of its commodities.
Australia’s 10-year government bond yield slipped to 4.33% as investors digested minutes from the Reserve Bank of Australia’s (RBA) March 31–April 1 meeting. The Minutes indicated that Q1 data showed trimmed mean inflation dipping below 3% while consumer demand appeared to be picking up.
The RBA signaled that while the May meeting could be a suitable time to revisit monetary policy, no decision had yet been made. Markets are currently pricing in a 25-basis point rate cut in May and expect approximately 120 basis points of easing over the year. Focus now shifts to Thursday’s employment report, which could provide key labor market signals and influence the RBA’s next move.
Australian Dollar advances as US Dollar remains subdued amid eroding investor confidence
- The US Dollar Index (DXY), which tracks the USD against a basket of six major currencies, is trading lower at near 99.80 at the time of writing. Later in the day, US Retail Sales data for March is set to be released, potentially providing insight into how rising tariff concerns are influencing consumer spending.
- A recent consumer sentiment survey by the Federal Reserve Bank of New York shows a sharp increase in the number of households expecting higher inflation, weaker job prospects, and worsening credit conditions in the coming months.
- Atlanta Fed President Raphael Bostic remarked during early Tuesday’s market session that the US central bank still has a long road ahead to achieve its 2% inflation target, casting doubt on market expectations for additional interest rate cuts.
- The University of Michigan’s sentiment index dropped to 50.8 in April, while one-year inflation expectations surged to 6.7%. The US Producer Price Index (PPI) rose 2.7% year-over-year in March, down from 3.2% in February, with the core rate easing to 3.3%. Jobless claims ticked up to 223,000, although continuing claims declined to 1.85 million—pointing to a mixed picture in the labor market.
- Escalating trade tensions between the US and China have revived concerns about a potential global economic slowdown. On Friday, China’s Ministry of Finance announced a sharp increase in tariffs on US goods, raising them from 84% to 125%. This action came in response to President Trump’s earlier move to raise tariffs on Chinese imports to 145%.
- The US Consumer Price Index (CPI) inflation eased to 2.4% year-over-year in March, down from 2.8% in February and below the market forecast of 2.6%. Core CPI, which excludes food and energy prices, rose 2.8% annually, compared to 3.1% previously and missing the 3.0% estimate. On a monthly basis, headline CPI dipped by 0.1%, while core CPI edged up by 0.1%.
- The People's Bank of China (PBoC) is expected to implement further monetary easing in Q2 2025. This includes a potential 15 basis point cut to the loan prime rate (LPR) and a minimum 25 basis point reduction in the reserve requirement ratio (RRR). According to Citi analysts, cited in a Reuters report, there’s an increasing likelihood that domestic stimulus measures will be accelerated in response to mounting external pressures.
Australian Dollar holds gains near 0.6350 due to persistent bullish bias
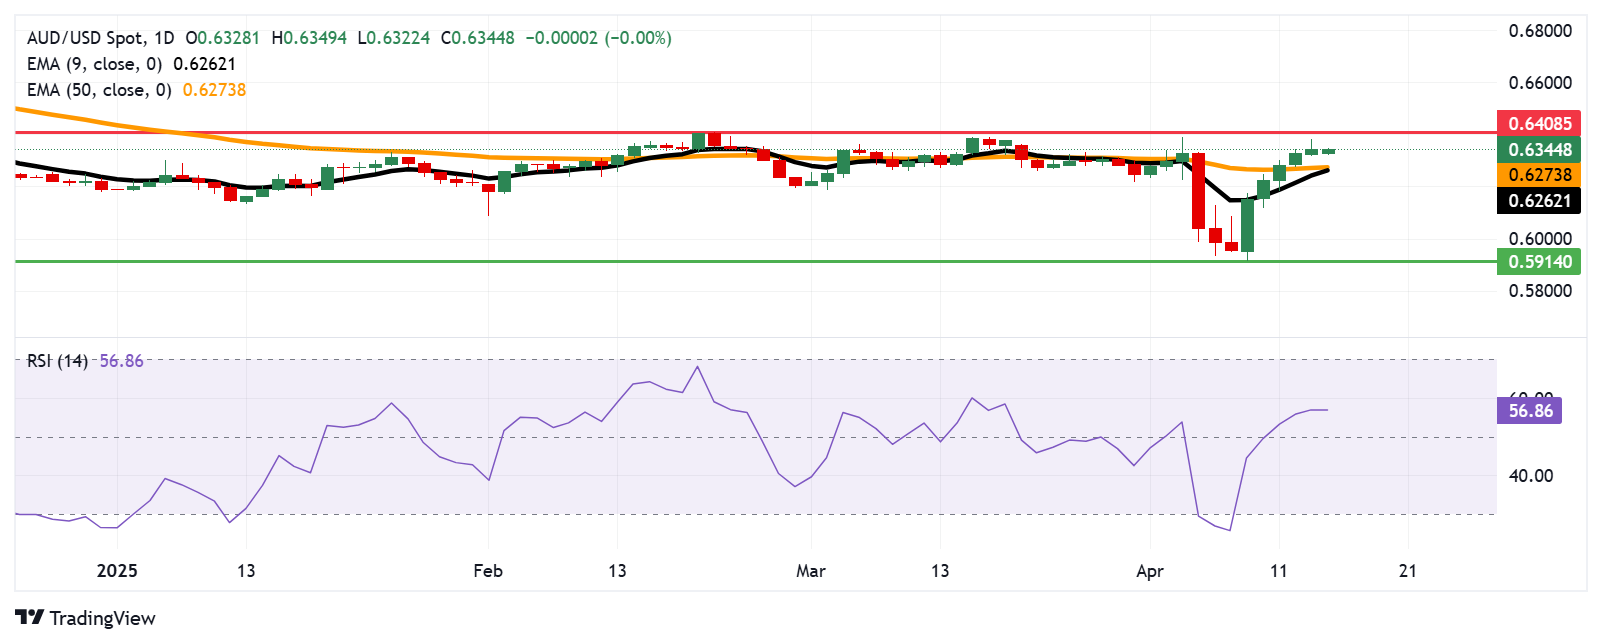
The AUD/USD pair is hovering around the 0.6350 level on Wednesday, with daily chart technicals signaling a bullish outlook. The pair continues to trade above both the nine-day and 50-day Exponential Moving Averages (EMAs), while the 14-day Relative Strength Index (RSI) holds above the neutral 50 mark, supporting the ongoing upward momentum.
On the upside, a break above 0.6400—the psychological barrier—could pave the way for a retest of the four-month high at 0.6408, last seen on February 21.
Initial support lies at the 50-day EMA near 0.6273, followed by the nine-day EMA around 0.6262. A clear drop below these levels would challenge the short-term bullish structure and could open the path toward the 0.5914 region—its lowest since March 2020—and the critical 0.5900 psychological mark.
AUD/USD: Daily Chart
Australian Dollar PRICE Today
The table below shows the percentage change of Australian Dollar (AUD) against listed major currencies today. Australian Dollar was the strongest against the US Dollar.
| USD | EUR | GBP | JPY | CAD | AUD | NZD | CHF | |
|---|---|---|---|---|---|---|---|---|
| USD | -0.41% | -0.17% | -0.39% | -0.09% | -0.35% | -0.11% | -0.78% | |
| EUR | 0.41% | 0.26% | 0.03% | 0.31% | 0.29% | 0.32% | -0.38% | |
| GBP | 0.17% | -0.26% | -0.25% | 0.06% | 0.04% | 0.06% | -0.59% | |
| JPY | 0.39% | -0.03% | 0.25% | 0.31% | 0.35% | 0.34% | -0.43% | |
| CAD | 0.09% | -0.31% | -0.06% | -0.31% | 0.01% | -0.01% | -0.61% | |
| AUD | 0.35% | -0.29% | -0.04% | -0.35% | -0.01% | 0.00% | -0.62% | |
| NZD | 0.11% | -0.32% | -0.06% | -0.34% | 0.00% | -0.00% | -0.64% | |
| CHF | 0.78% | 0.38% | 0.59% | 0.43% | 0.61% | 0.62% | 0.64% |
The heat map shows percentage changes of major currencies against each other. The base currency is picked from the left column, while the quote currency is picked from the top row. For example, if you pick the Australian Dollar from the left column and move along the horizontal line to the US Dollar, the percentage change displayed in the box will represent AUD (base)/USD (quote).
Economic Indicator
Gross Domestic Product (YoY)
The Gross Domestic Product (GDP), released by the National Bureau of Statistics of China on a monthly basis, is a measure of the total value of all goods and services produced in China during a given period. The GDP is considered as the main measure of China’s economic activity. The YoY reading compares economic activity in the reference quarter compared with the same quarter a year earlier. Generally speaking, a rise in this indicator is bullish for the Renminbi (CNY), while a low reading is seen as bearish.
Read more.Last release: Wed Apr 16, 2025 02:00
Frequency: Quarterly
Actual: 5.4%
Consensus: 5.1%
Previous: 5.4%
Source:
Artigos Recomendados


