USD/CAD Price Forecast: Breaks below 1.3950 as bearish bias prevails

Fonte Fxstreet
  • USD/CAD could extend its decline, with the daily chart pointing to a sustained bearish trend.
  • The 14-day RSI remains below the 50 mark, reinforcing the persistent bearish bias.
  • The nine-day EMA near 1.4023 could serve as the immediate resistance level.

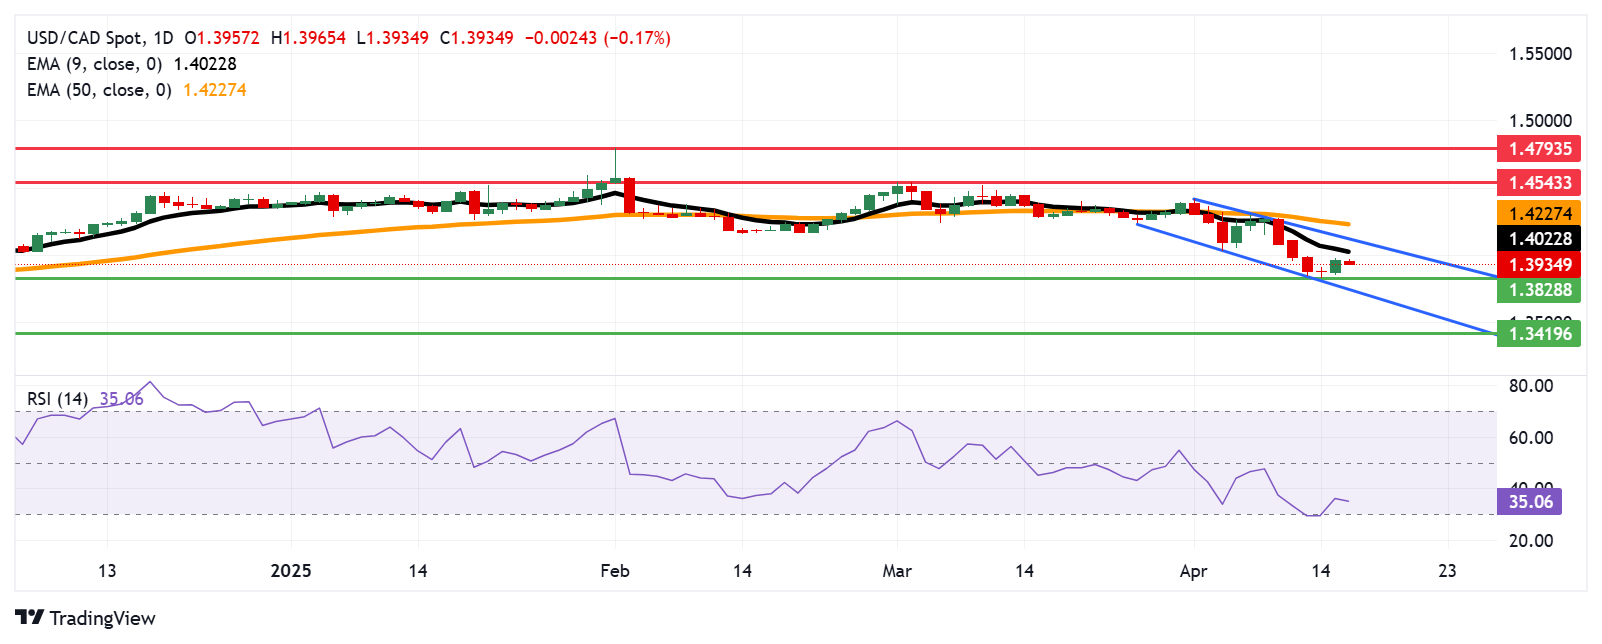
The USD/CAD pair slips slightly after posting gains in the previous session, trading near 1.3940 during Wednesday’s Asian session. Technical analysis on the daily chart indicates a prevailing bearish trend as the pair continues to move lower within a descending channel.

Additionally, the USD/CAD pair continues to trade below the nine-day Exponential Moving Average (EMA), indicating subdued short-term momentum. At the same time, the 14-day Relative Strength Index (RSI) has climbed above the 30 level, hinting at a potential short-term corrective rebound. However, with the 14-day RSI still below the 50 threshold, the overall bearish bias remains intact.

On the downside, the USD/CAD pair could revisit the six-month low of 1.3828, recorded on Monday, aligning closely with the lower boundary of the descending channel around the 1.3750 region. A clear break below this support zone would likely strengthen the bearish outlook and open the door for a decline toward the 1.3419 area — the lowest level since February 2024.

Initial resistance for the USD/CAD pair is located at the nine-day EMA around 1.4023, followed by the upper boundary of the descending channel near 1.4130. A breakout above this channel could signal a shift to a bullish bias, potentially pushing the pair toward the 50-day EMA at 1.4227. Beyond that, the next key resistance lies at the two-month high of 1.4543, reached on March 4.

USD/CAD: Daily Chart
Canadian Dollar PRICE Today

The table below shows the percentage change of Canadian Dollar (CAD) against listed major currencies today. Canadian Dollar was the weakest against the Swiss Franc.

USD EUR GBP JPY CAD AUD NZD CHF
USD -0.59% -0.27% -0.43% -0.17% -0.38% -0.38% -0.97%
EUR 0.59% 0.34% 0.15% 0.40% 0.44% 0.22% -0.39%
GBP 0.27% -0.34% -0.19% 0.07% 0.11% -0.12% -0.67%
JPY 0.43% -0.15% 0.19% 0.28% 0.37% 0.11% -0.57%
CAD 0.17% -0.40% -0.07% -0.28% 0.07% -0.18% -0.72%
AUD 0.38% -0.44% -0.11% -0.37% -0.07% -0.25% -0.78%
NZD 0.38% -0.22% 0.12% -0.11% 0.18% 0.25% -0.56%
CHF 0.97% 0.39% 0.67% 0.57% 0.72% 0.78% 0.56%

The heat map shows percentage changes of major currencies against each other. The base currency is picked from the left column, while the quote currency is picked from the top row. For example, if you pick the Canadian Dollar from the left column and move along the horizontal line to the US Dollar, the percentage change displayed in the box will represent CAD (base)/USD (quote).

Isenção de responsabilidade: Apenas para fins informativos. O desempenho passado não é indicativo de resultados futuros.
placeholder
Por que a queda drástica de 90% do token Mantra eliminou uma participação de mercado de US$ 5,2 bilhõesO preço do Mantra (OM) pairou em US $ 0,83 durante a sessão asiática na segunda-feira, após uma queda massiva de 90% de US $ 6,33 no domingo. A queda eliminou US$ 5,2 bilhões da capitalização de mercado do token, rapidamente atraindo comparações com o infame colapso da Terra LUNA e da FTX em 2022.
Autor  FXStreet
4 Mês 14 Dia Seg
O preço do Mantra (OM) pairou em US $ 0,83 durante a sessão asiática na segunda-feira, após uma queda massiva de 90% de US $ 6,33 no domingo. A queda eliminou US$ 5,2 bilhões da capitalização de mercado do token, rapidamente atraindo comparações com o infame colapso da Terra LUNA e da FTX em 2022.
placeholder
Baleia adquire 16.000 ETH enquanto a Fundação Ethereum promete apoio para L1, RWA e stablecoinsA Fundação Ethereum, por meio de seu Co-Diretor Executivo, Tomasz K. Stańczak, delineou uma versão simplificada de seu roteiro no domingo.
Autor  FXStreet
Ontem 02: 52
A Fundação Ethereum, por meio de seu Co-Diretor Executivo, Tomasz K. Stańczak, delineou uma versão simplificada de seu roteiro no domingo.
placeholder
Warren Buffett detém cash suficiente para comprar 476 empresas no S&P 500 nos valores atuaisWarren Buffett acumulou tanto cash em Berkshire Hathaway que ele poderia comprar as 476 empresas inferiores no S&P 500 agora. Sua pilha cash está em US $ 334 bilhões, e isso é suficiente para engolir 95% do índice. O S&P 500, que cobre cerca de 80% de todas as ações públicas dos EUA por […]
Autor  Cryptopolitan
9 horas atrás
Warren Buffett acumulou tanto cash em Berkshire Hathaway que ele poderia comprar as 476 empresas inferiores no S&P 500 agora. Sua pilha cash está em US $ 334 bilhões, e isso é suficiente para engolir 95% do índice. O S&P 500, que cobre cerca de 80% de todas as ações públicas dos EUA por […]
placeholder
Previsão do Preço da Ripple: Entradas em bolsas aumentam enquanto XRP cai, o que vem a seguir?A Ripple (XRP) corrigiu junto com outros grandes ativos digitais, incluindo Bitcoin (BTC) e Ethereum (ETH), e foi negociada a $2,08 no momento da redação deste texto, na quarta-feira. A retração afetou o mercado de criptomoedas, fazendo com que a capitalização total caísse 3,2%, para $2,736 trilhões.
Autor  FXStreet
5 horas atrás
A Ripple (XRP) corrigiu junto com outros grandes ativos digitais, incluindo Bitcoin (BTC) e Ethereum (ETH), e foi negociada a $2,08 no momento da redação deste texto, na quarta-feira. A retração afetou o mercado de criptomoedas, fazendo com que a capitalização total caísse 3,2%, para $2,736 trilhões.
placeholder
Trump em Xi: nós anuncia 245% de tarifa na ChinaPresident Trump aumenta a guerra comercial EUA-China com uma tarifa de 245% sobre as importações chinesas, citando a segurança nacional e a retaliação econômica.
Autor  Cryptopolitan
2 horas atrás
President Trump aumenta a guerra comercial EUA-China com uma tarifa de 245% sobre as importações chinesas, citando a segurança nacional e a retaliação econômica.
Produtos relacionados
goTop
quote