


Dow Jones stumbles in pre-tariff volatility
- The Dow Jones roiled on Tuesday as markets brace for tariffs.
- US business survey indexes contracted for a second straight month.
- US tariffs are expected to take effect “immediately” after the announcement on Wednesday.
The Dow Jones Industrial Average (DJIA) kicked around the charts on Tuesday, declining after US Purchasing Managers Index (PMI) survey results came in worse than expected, but recovered ground after markets pivoted to hoping for a ramp-up in the Fed’s rate-cutting cycle. Investors are largely sidelined as traders await this week’s long-threatened tariff announcement from United States (US) President Donald Trump, which he has dubbed “Liberation Day”.
The exact details of what tariffs are getting announced and when they will come into effect remains elusive. The Trump administration has been playing a game of chicken with markets on tariffs since Trump assumed office on January 20, announcing, changing, and pulling back on multiple waves of tariffs over the past 71 days. President Trump has leaned into his self-imposed deadline of April 2 for several months and is promising an ever-changing list of tariffs that could include flat import taxes on automobiles, lumber, and pharmaceuticals, in addition to across-the-board tariffs on most of the US’s largest trading partners. President Trump’s tariff announcement is expected at 1900 GMT (4 pm EST) on Wednesday during a ceremony in the White House’s Rose Garden.
The US ISM Manufacturing PMI for March sank faster than expected, falling to 49.0 from 50.3 as businesses hunker down ahead of expected tariff announcements. Median market forecasts expected a print of 49.5 or better. The ISM Manufacturing New Orders Index also fell sharply for the second month in a row, declining to a two-year low of 45.2.
Read more economic data news: US JOLTS Job Openings decline to 7.56 million in February
Despite downside prints in key data and rising fears of Trump tariffs, rate markets took the opportunity to ramp up their bets of additional Fed easing this year. According to the CME’s FedWatch Tool, rate traders are now pricing in nearly 80% odds of at least a 25 bps rate trim from the Federal Reserve (Fed) at the June 18 policy meeting.
Stock news
Most equity indexes are holding close to flat on Tuesday. However, the Dow Jones is still trading around 200 points below Monday’s closing prices, cycling near 41,800. The Standard & Poor’s 500 eased slightly, falling below 5,600, while the Nasdaq Composite holds steady near 17,300.
Tesla (TSLA) rebounded 4.7% on Tuesday, climbing back to $271 per share. Despite a near-term recovery, the battered electric vehicle producer is still down sharply from record highs above $435 per share set last December. On the low side, Southwest Airlines (LUV) tumbled 6.8% to $31 per share after airline companies caught a hard downgrade this week, sending air travel stocks tumbling. Southwest Airlines was the loser of the bunch, getting downgraded to a firm “underperform” rating by Jeffries credit ratings analysts.
Read more stock news: Johnson & Johnson stock sinks on third talc verdict
Dow Jones price forecast
The Dow Jones Industrial Average is churning chart paper near the 200-day Exponential Moving Average (EMA) at the 42,000 handle as investors brace for the top on brewing geopolitical pressures to finally blow. The major equity index remains capped on the low side of record highs just above 45,000 set last November, but a firm technical floor appears to be priced in just north of the 40,000 major price level.
Dow Jones daily chart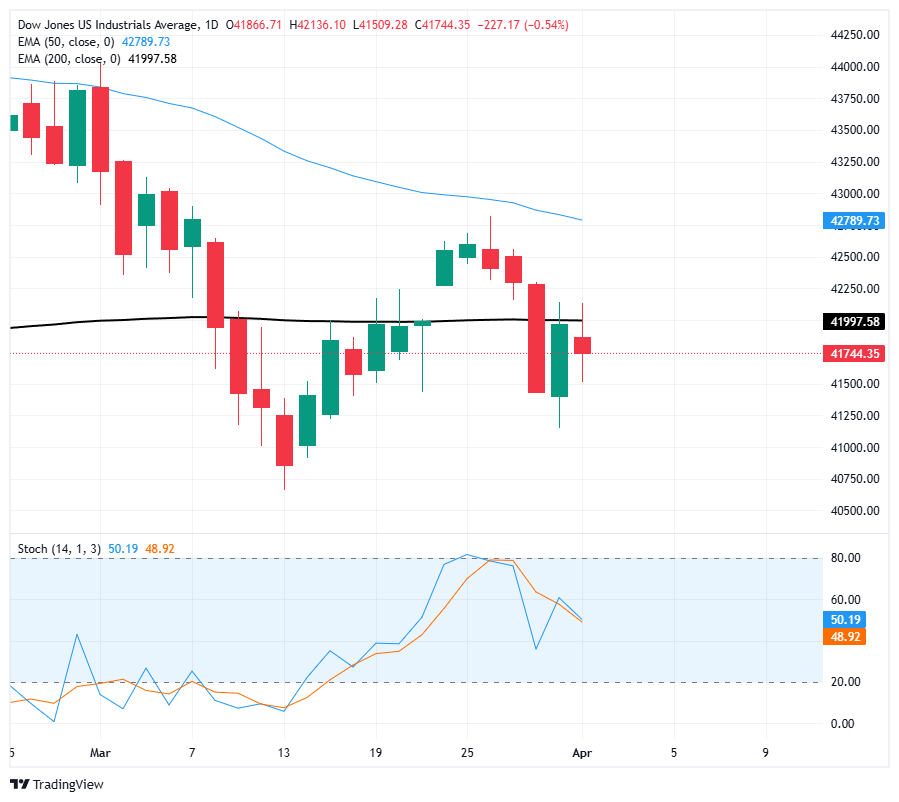
Dow Jones FAQs
The Dow Jones Industrial Average, one of the oldest stock market indices in the world, is compiled of the 30 most traded stocks in the US. The index is price-weighted rather than weighted by capitalization. It is calculated by summing the prices of the constituent stocks and dividing them by a factor, currently 0.152. The index was founded by Charles Dow, who also founded the Wall Street Journal. In later years it has been criticized for not being broadly representative enough because it only tracks 30 conglomerates, unlike broader indices such as the S&P 500.
Many different factors drive the Dow Jones Industrial Average (DJIA). The aggregate performance of the component companies revealed in quarterly company earnings reports is the main one. US and global macroeconomic data also contributes as it impacts on investor sentiment. The level of interest rates, set by the Federal Reserve (Fed), also influences the DJIA as it affects the cost of credit, on which many corporations are heavily reliant. Therefore, inflation can be a major driver as well as other metrics which impact the Fed decisions.
Dow Theory is a method for identifying the primary trend of the stock market developed by Charles Dow. A key step is to compare the direction of the Dow Jones Industrial Average (DJIA) and the Dow Jones Transportation Average (DJTA) and only follow trends where both are moving in the same direction. Volume is a confirmatory criteria. The theory uses elements of peak and trough analysis. Dow’s theory posits three trend phases: accumulation, when smart money starts buying or selling; public participation, when the wider public joins in; and distribution, when the smart money exits.
There are a number of ways to trade the DJIA. One is to use ETFs which allow investors to trade the DJIA as a single security, rather than having to buy shares in all 30 constituent companies. A leading example is the SPDR Dow Jones Industrial Average ETF (DIA). DJIA futures contracts enable traders to speculate on the future value of the index and Options provide the right, but not the obligation, to buy or sell the index at a predetermined price in the future. Mutual funds enable investors to buy a share of a diversified portfolio of DJIA stocks thus providing exposure to the overall index.
Artigos Recomendados


