
US Dollar recovers slightly, bouncing off 2024 lows
- The US Dollar in an attempt to snap a three-day losing streak.
- The Greenback experiences a technical bounce after testing key support levels.
- The US Dollar index trades near 101.50, with a long road to recovery ahead.
The US Dollar (USD) is catching up again, trading in slightly positive territory on Wednesday, after three consecutive sessions of sharp drops. The bounce appears to be a pure technical one after the US Dollar Index (DXY) hit 101.30 in early Asian trading, the low for 2024.
On the economic data front, the Federal Open Market Committee (FOMC) Meeting Minutes for July will be published, although these are not expected to move the needle ahead of Jackson Hole on Friday. Besides the FOMC Minutes, the Nonfarm Payrolls Benchmark revision could become interesting. Markets were rattled by the latest US Nonfarm Payrolls number on the first Friday of August, a data point that triggered the unwinding of the carry trade which had spillover effects in equities and caused recession concerns for the US economy. Although the revisions are not going to cover August, any big change on earlier numbers might still bear some importance.
Daily digest market movers: Vacuum until Friday
- At 14:00 GMT, the Nonfarm Payrolls Benchmark revision is due to come out. The revisions will cover 12 months up to March of this year.
- The US Treasury is set to allocate a 20-year Bond at 17:00 GMT.
- At 18:00 GMT, the Fed will release its Minutes from July’s meeting.
- Asian equity markets are facing a bit of pressure and are in the red, which helps the US Dollar strengthen a touch. European and US equities are on the rise.
- The CME Fedwatch Tool shows a 69.5% chance of a 25 basis points (bps) interest rate cut by the Fed in September against a 30.5% chance for a 50 bps cut. Another 25 bps cut (if September is a 25 bps cut) is expected in November by 50.9%, while there is a 40.9% chance that rates will be 75 bps below the current levels and an 8.2% probability of rates being 100 basis points lower.
- The US 10-year benchmark rate trades at 3.81%, printing a fresh low for the week.
Economic Indicator
FOMC Minutes
FOMC stands for The Federal Open Market Committee that organizes 8 meetings in a year and reviews economic and financial conditions, determines the appropriate stance of monetary policy and assesses the risks to its long-run goals of price stability and sustainable economic growth. FOMC Minutes are released by the Board of Governors of the Federal Reserve and are a clear guide to the future US interest rate policy.
Read more.Next release: Wed Aug 21, 2024 18:00
Frequency: Irregular
Consensus: -
Previous: -
Source: Federal Reserve
Minutes of the Federal Open Market Committee (FOMC) is usually published three weeks after the day of the policy decision. Investors look for clues regarding the policy outlook in this publication alongside the vote split. A bullish tone is likely to provide a boost to the greenback while a dovish stance is seen as USD-negative. It needs to be noted that the market reaction to FOMC Minutes could be delayed as news outlets don’t have access to the publication before the release, unlike the FOMC’s Policy Statement.
US Dollar Index Technical Analysis: Back to the drawing board
The US Dollar Index (DXY) is trying to snap the losing streak with some conviction. The bounce comes after the DXY hit the low seen on January 2, which is the low of this year as well. The question is if this has room to go higher considering there are no real significant data elements or market movers ahead of Jackson Hole on Friday.
Defining pivotal levels becomes very important in order to avoid any dead-cat bounces, in which traders pile in too quickly in a trade and get caught on the wrong side of the fence once the course reverses. First up is 103.18, a level that traders were unable to hold last week. Next up, a heavy resistance level is at 103.99-104.00, and inches above there is the 200-day Simple Moving Average (SMA) at 104.07.
On the downside, 101.30 (low from January 2) is trying to hold for now and has triggered a bounce thus far. Should it break, the low of December 28 at 100.62 will be the ultimate level to look out for.
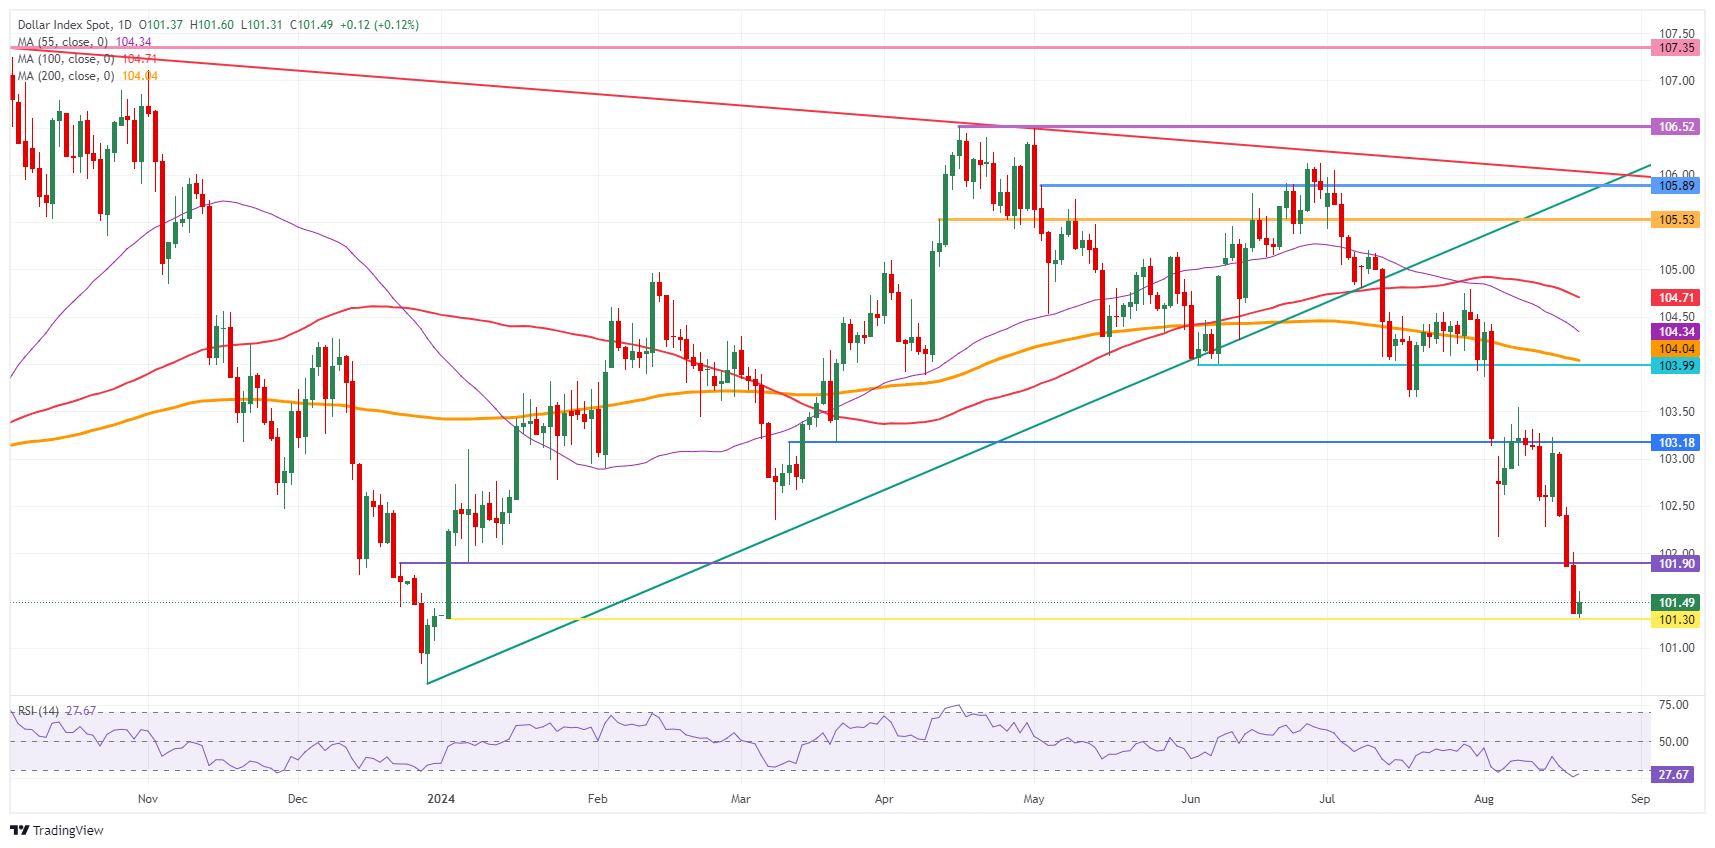
US Dollar Index: Daily Chart
US Dollar FAQs
The US Dollar (USD) is the official currency of the United States of America, and the ‘de facto’ currency of a significant number of other countries where it is found in circulation alongside local notes. It is the most heavily traded currency in the world, accounting for over 88% of all global foreign exchange turnover, or an average of $6.6 trillion in transactions per day, according to data from 2022. Following the second world war, the USD took over from the British Pound as the world’s reserve currency. For most of its history, the US Dollar was backed by Gold, until the Bretton Woods Agreement in 1971 when the Gold Standard went away.
The most important single factor impacting on the value of the US Dollar is monetary policy, which is shaped by the Federal Reserve (Fed). The Fed has two mandates: to achieve price stability (control inflation) and foster full employment. Its primary tool to achieve these two goals is by adjusting interest rates. When prices are rising too quickly and inflation is above the Fed’s 2% target, the Fed will raise rates, which helps the USD value. When inflation falls below 2% or the Unemployment Rate is too high, the Fed may lower interest rates, which weighs on the Greenback.
In extreme situations, the Federal Reserve can also print more Dollars and enact quantitative easing (QE). QE is the process by which the Fed substantially increases the flow of credit in a stuck financial system. It is a non-standard policy measure used when credit has dried up because banks will not lend to each other (out of the fear of counterparty default). It is a last resort when simply lowering interest rates is unlikely to achieve the necessary result. It was the Fed’s weapon of choice to combat the credit crunch that occurred during the Great Financial Crisis in 2008. It involves the Fed printing more Dollars and using them to buy US government bonds predominantly from financial institutions. QE usually leads to a weaker US Dollar.
Quantitative tightening (QT) is the reverse process whereby the Federal Reserve stops buying bonds from financial institutions and does not reinvest the principal from the bonds it holds maturing in new purchases. It is usually positive for the US Dollar.
Artigos Recomendados


