
Bitcoin Price Forecast: BTC trades below $82,000 as Bybit hackers cash out some of its crypto heist
- Bitcoin price hovers around $82,000 on Monday after falling nearly 15% last week.
- This price correction triggered a series of liquidations across the crypto market, totaling $687.73 in the past 24 hours.
- QCP Capital report highlights that momentum was derailed by the Bybit hackers cashing out on Sunday, causing BTC to decline again.
Bitcoin (BTC) hovers around $82,000 on Monday after falling nearly 15% last week. This price correction triggered a series of liquidations across the crypto market, totaling $687.73 in the past 24 hours. A QCP Capital report highlights that momentum was derailed by the Bybit hackers cashing out at least $300 million of their record-breaking $1.5 billion crypto heist on Sunday, causing BTC to decline again.
Bitcoin price dips wipe over $690 million from the market
Bitcoin price recovers slightly, trading at around $82,800, during the European session on Monday after falling nearly 15% last week. Only on Sunday, BTC dipped more than 6%, reaching a low of $80,000.
This price correction triggered a series of liquidations across the crypto market, totaling $687.73 in the past 24 hours. The largest single liquidation order happened on Binance- BTCUSDT, valued at $32.09 million, according to Coinglass data.
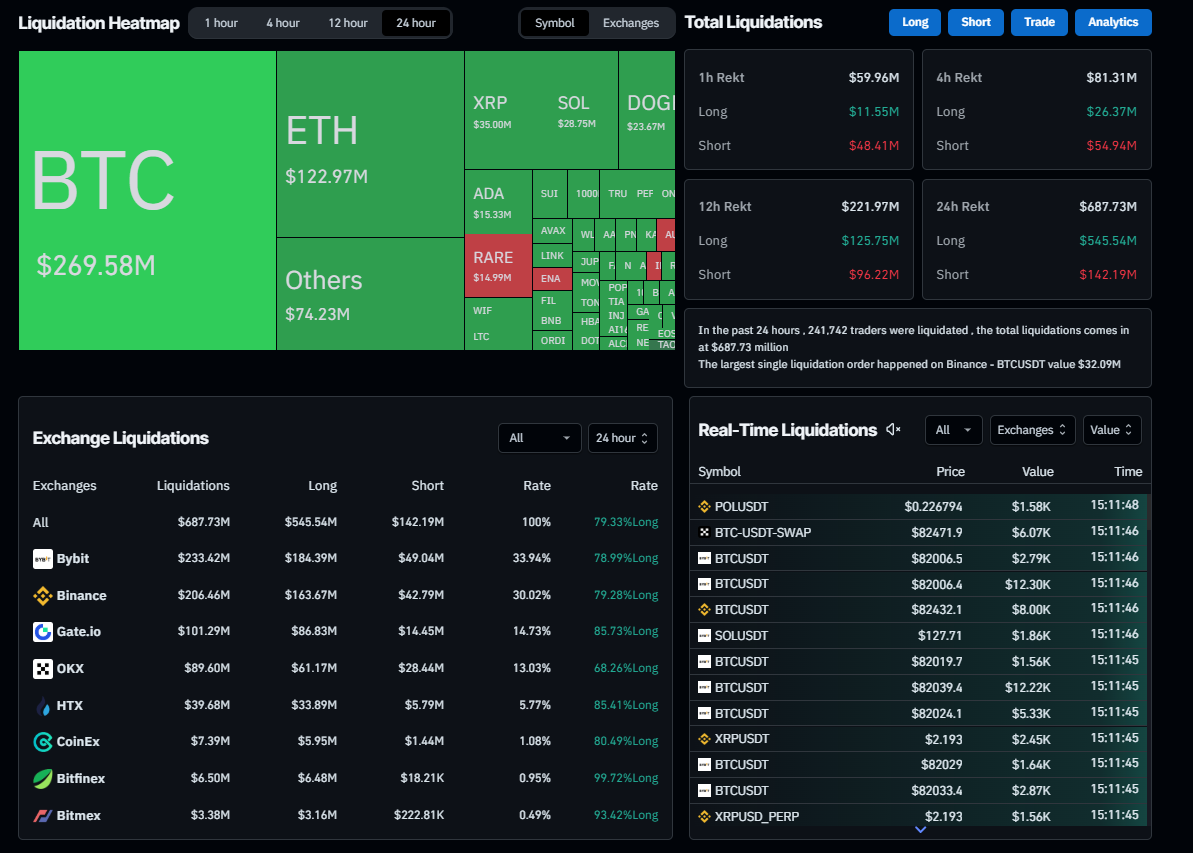
Liquidation Heatmap chart. Source: Coinglass
In an exclusive interview, Ryan Lee, Chief Analyst at Bitget Research, told FXStreet, “Bitcoin is expected to face a critical week of price movement with support levels between $70,000 and $75,000 and a pivotal resistance zone around $85,000-$87,000.”
Lee explained that a failure to maintain the $77,000 level could lead BTC to test the lower range of $70,000-$72,000. However, if the market sees a recovery, a potential bounce from $75,000 could push the price back into the $80,000-$85,000 range.
Bitcoin investors await key macroeconomics releases
In the interview, Lee further explained that the most likely scenario for this week suggests a mid-week test of $72,000-$75,000, with Bitcoin stabilizing near $83,000 by March 18-19, depending on broader market sentiment and external factors like regulatory news and upcoming FOMC meeting.
Moreover, QCP Capital’s report highlights that risk assets, such as US equities and BTC, are currently trading near their recent lows, and with tariff risks still looming, volatility could pick up, heading into key US macro data releases — Consumer Price Index (CPI) on Wednesday and Producer Price Index (PPI) on Thursday.
The report continued that Friday’s Non-Farm Payrolls (NFP) data last week provided some relief for equities and crypto, reinforcing expectations of further interest rate cuts by the Federal Reserve (Fed) in May.
The report further explained that the stage seemed set for a steady recovery this week. However, this momentum was derailed by the Bybit hackers cashing out at least $300 million of their record-breaking $1.5 billion crypto heist during thin liquidity hours on Sunday, causing BTC to decline again.
“Today’s price selloff may also be exacerbated by holders preemptively front-running further hacker-driven supply, now that the hackers have shown a willingness to cash out rather than risk further losses — having already seen their stolen assets depreciate by 25%. In response, risk reversals have become even more bid for Puts over the past 24 hours, reflecting growing concerns over additional selling pressure,” says QCP’s analyst.
Bitcoin Price Forecast: BTC bears aiming for $78,000 mark
Bitcoin price broke and closed below its 200-day Exponential Moving Average (EMA) at $85,754 on Sunday, declining by 6.37%. At the time of writing on Monday, it hovers at around $81,800.
If BTC continues its downward trend, it could extend the decline to test the February 28 low of $78,258. A successful close below this level would extend an additional decline to retest its next support level at $73,072.
The Relative Strength Index (RSI) on the daily chart reads 36, after being rejected from its neutral level of 50 last week, indicating a bearish momentum. Moreover, the Moving Average Convergence Divergence (MACD) indicator also showed a bearish crossover on Sunday, giving a sell signal and suggesting a downward trend.
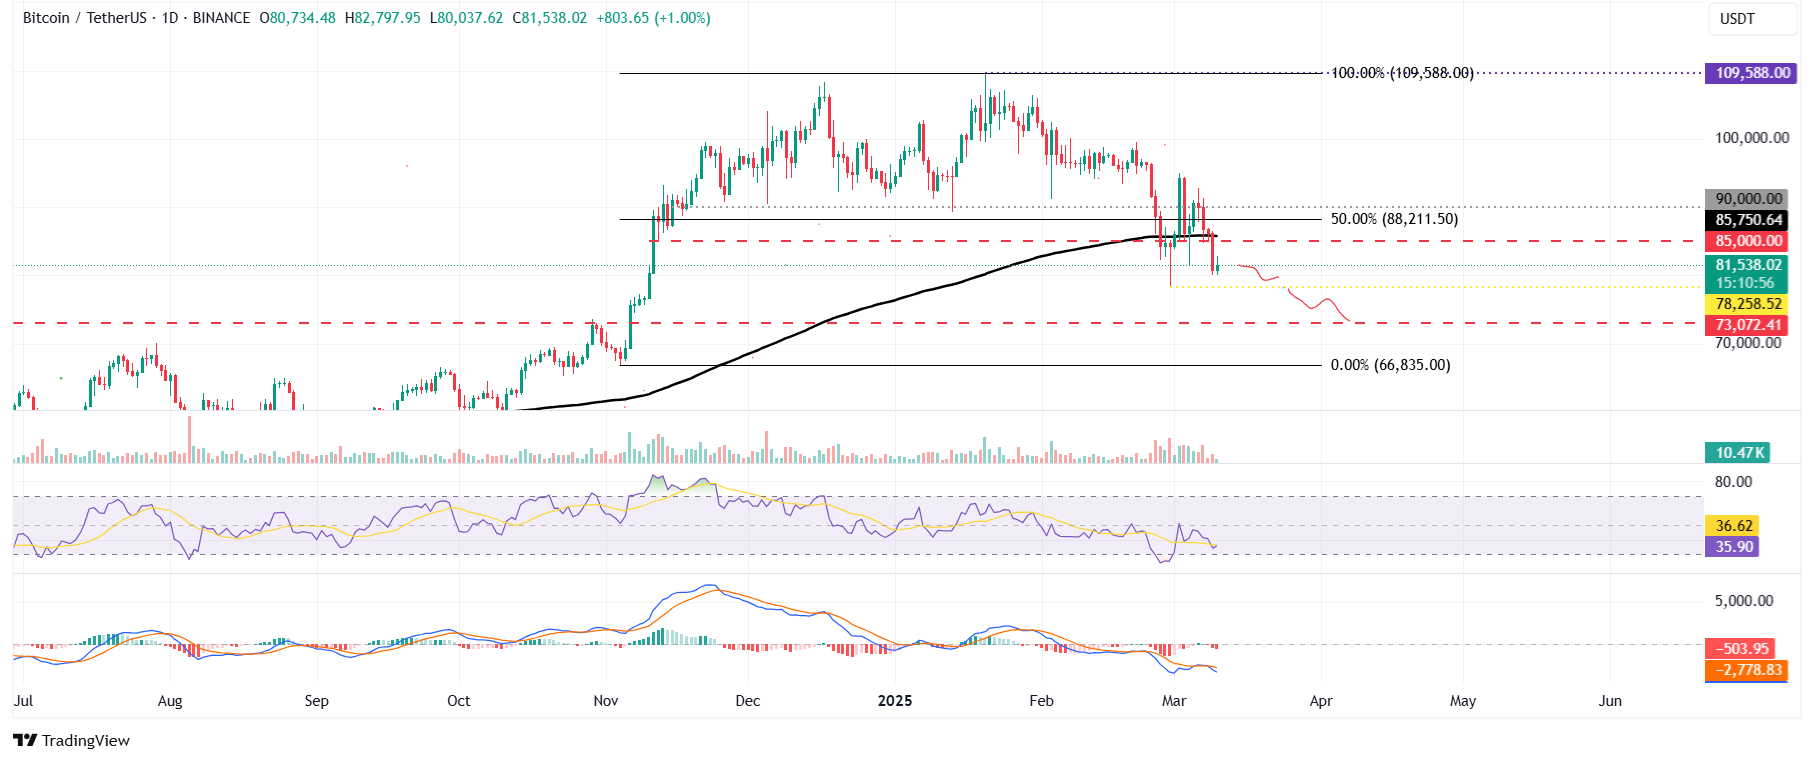
BTC/USDT daily chart
On the contrary, if BTC recovers, it could extend the recovery to $85,000.
Bitcoin, altcoins, stablecoins FAQs
Bitcoin is the largest cryptocurrency by market capitalization, a virtual currency designed to serve as money. This form of payment cannot be controlled by any one person, group, or entity, which eliminates the need for third-party participation during financial transactions.
Altcoins are any cryptocurrency apart from Bitcoin, but some also regard Ethereum as a non-altcoin because it is from these two cryptocurrencies that forking happens. If this is true, then Litecoin is the first altcoin, forked from the Bitcoin protocol and, therefore, an “improved” version of it.
Stablecoins are cryptocurrencies designed to have a stable price, with their value backed by a reserve of the asset it represents. To achieve this, the value of any one stablecoin is pegged to a commodity or financial instrument, such as the US Dollar (USD), with its supply regulated by an algorithm or demand. The main goal of stablecoins is to provide an on/off-ramp for investors willing to trade and invest in cryptocurrencies. Stablecoins also allow investors to store value since cryptocurrencies, in general, are subject to volatility.
Bitcoin dominance is the ratio of Bitcoin's market capitalization to the total market capitalization of all cryptocurrencies combined. It provides a clear picture of Bitcoin’s interest among investors. A high BTC dominance typically happens before and during a bull run, in which investors resort to investing in relatively stable and high market capitalization cryptocurrency like Bitcoin. A drop in BTC dominance usually means that investors are moving their capital and/or profits to altcoins in a quest for higher returns, which usually triggers an explosion of altcoin rallies.
Artigos Recomendados


