


Dogecoin plunges to four-month low as $78 million in liquidations shake market
- Dogecoin price hovers around $0.173 on Monday after crashing nearly 30% last week.
- The price correction in DOGE has triggered a wave of over $22 million in liquidations in the last 24 hours.
- The technical outlook suggests further pullback, targeting $0.142.
Dogecoin (DOGE) hovers around $0.173 on Monday after crashing nearly 30% last week. The recent correction in DOGE has triggered a wave of over $22 million in liquidations in the last 24 hours and more than $78 million last week. The technical outlook suggests a further pullback targeting the $0.14 mark.
Dogecoin price dips, wiping over $22 million in the last 24 hours
Dogecoin price declined nearly 30% last week and hovers around $0.173 during the early European session on Monday. This correction has triggered a wave of liquidations, resulting in over $22 million in liquidations in the last 24 hours and $78 million last week, according to data from CoinGlass.
Strong liquidations like this could spark Fear, Uncertainty, and Doubt (FUD) among Dogecoin investors, raising selling pressure and leading to a further decline in DOGE price.
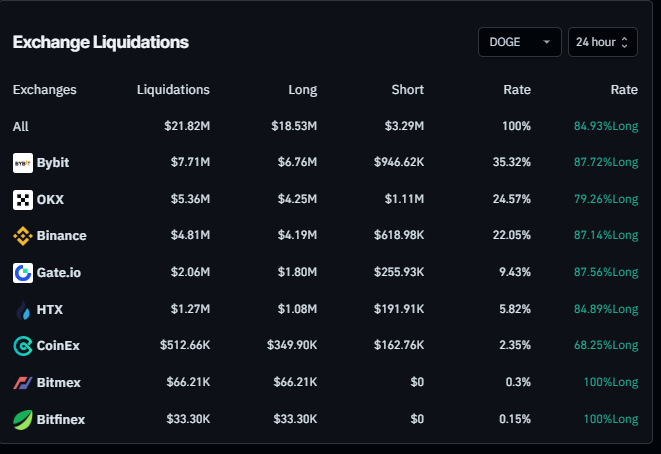
Dogecoin liquidation chart last 24 hours. Source: Coinglass
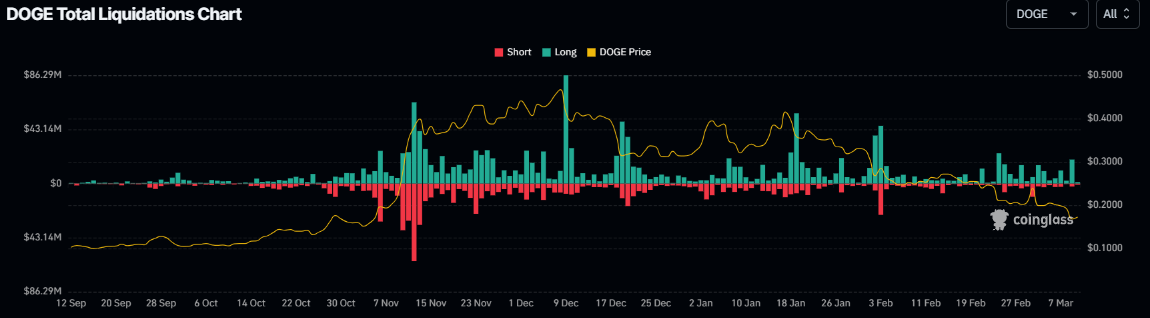
DOGE total liquidation chart. Source: Coinglass
Dogecoin Price Forecast: DOGE closes below its 100-week EMA
Dogecoin's price declined more than 30% last week and closed below its 100-week Exponential Moving Average (EMA) at $0.173 on Sunday, reaching levels not seen since early November. On Monday, DOGE hovers at around $0.173.
The Relative Strength Index (RSI) on the weekly chart reads 40, slipping below its neutral level of 50 and indicating increasing bearish momentum. The Moving Average Convergence Divergence (MACD) indicator also showed a bearish crossover last week, hinting at a further downtrend ahead.
If DOGE continues its correction, it will extend the decline to test its November 3 low of $0.142.
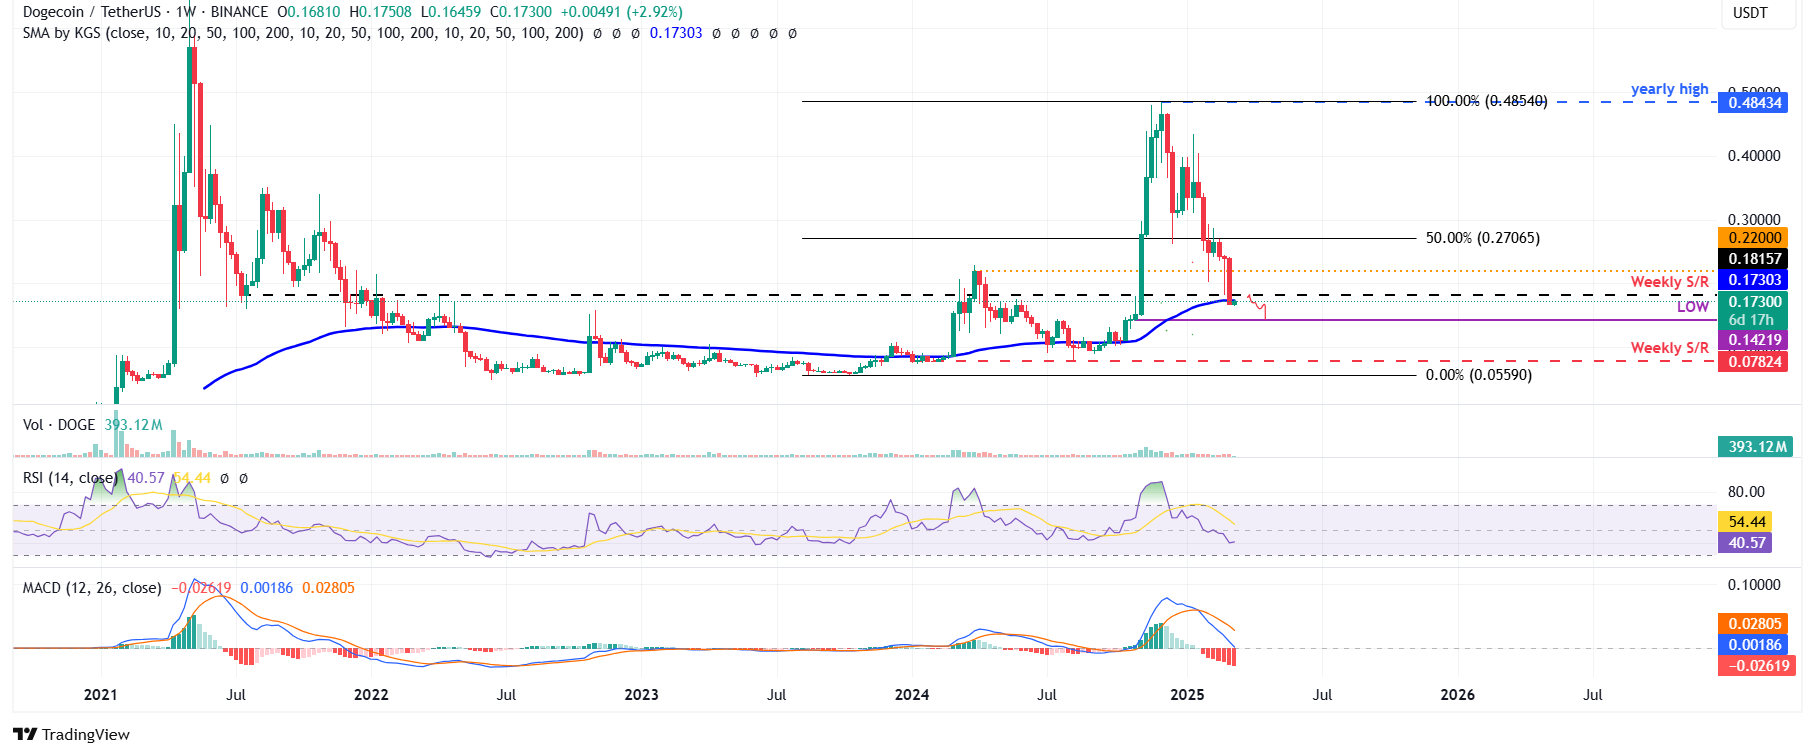
DOGE/USDT weekly chart
However, if DOGE recovers and closes above the weekly level at $0.181, it would extend the recovery to retest its next resistance level at $0.220.
Artigos Recomendados


