
ETH sellers mount $1.8B resistance as tariffs nullify bullish catalysts from Trump and Ethereum Foundation
- Ethereum price tumbled 16% to $2,100 on Monday after briefly rallying 15% from $2,200 to $2,550 following Trump’s Ethereum endorsement.
- Ethereum Foundation’s announcement of a leadership reshuffle significantly bolstered market sentiment, fueling weekend optimism before Monday’s sharp price retracement.
- Short-term traders aggressively sold the news to secure profits, allowing ETH bears to regain 55% dominance with $1.8 billion in short positions.
Ethereum price dipped 16% to hit $2,100 on Monday, after climbing 15% from $2,200 to $2,550 hours after Trump confirmed the inclusion of ETH in a proposed US Crypto Strategic Reserve. With short-term traders booking profits, market sentiment now hangs in the balance.
Ethereum (ETH) rally halts at $2,500 as traders lock-in profits early
Ethereum price entered a major rally over the weekend as markets reacted to a major announcement from US President Donald Trump. On March 2, Trump issued an executive order, establishing a crypto strategic reserve.
The initial announcement only featured Solana (SOL), Cardano (ADA) and Ripple (XRP). However, within an hour, the President clarified that Ethereum (ETH) and Bitcoin (BTC) are included as well.
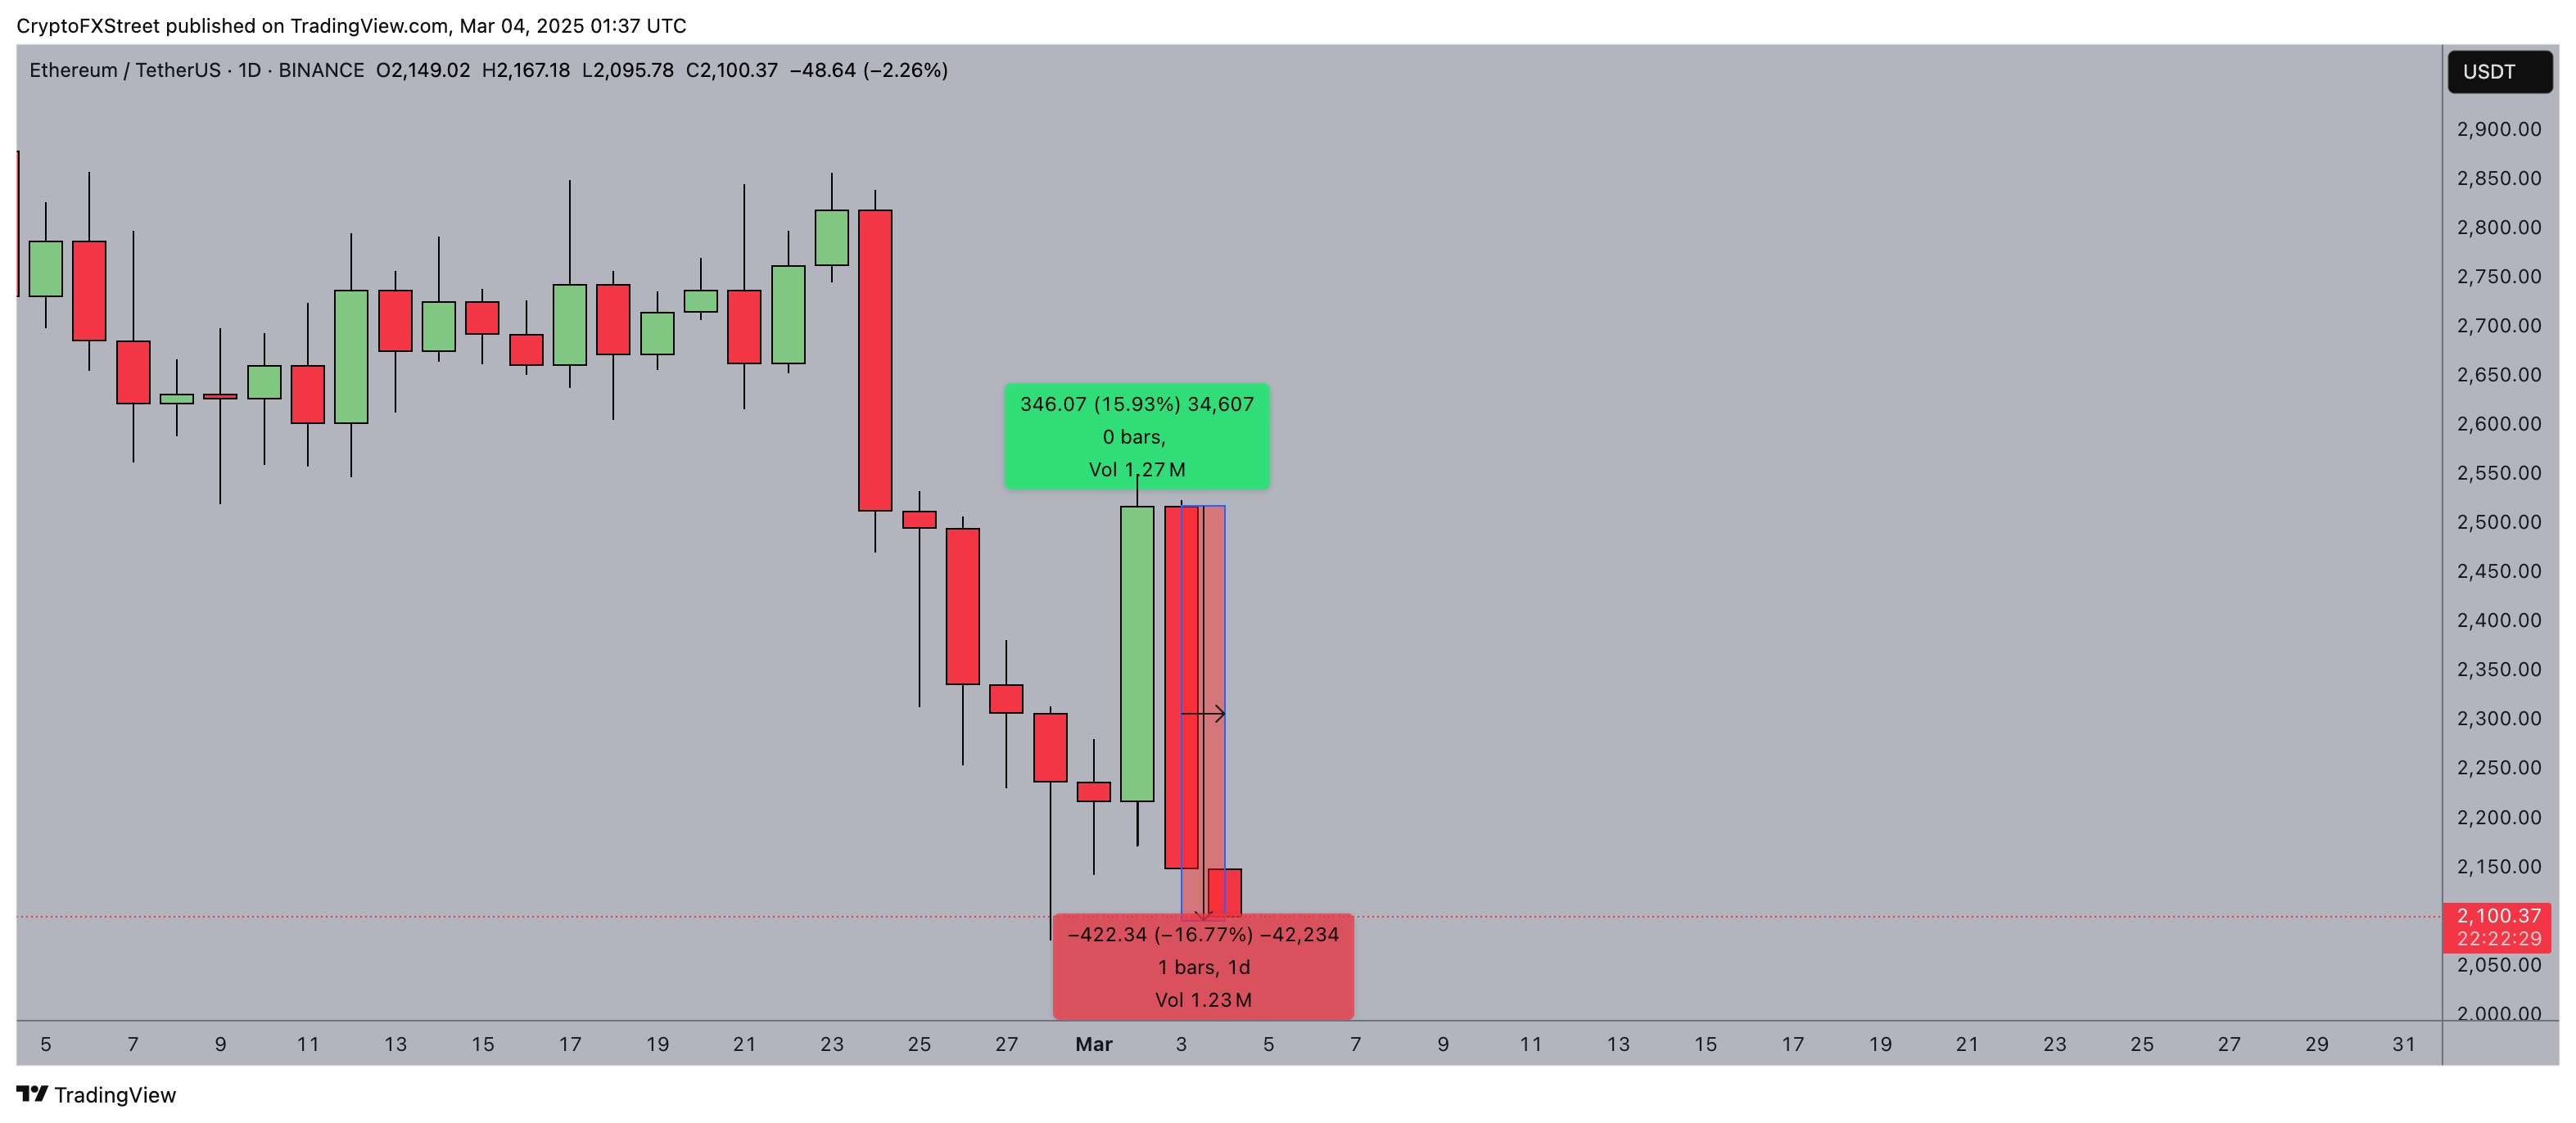
While ETH was clearly late to the party, price rapidly climbed 15% from $2,200 to $2,550 within an hour after Trump confirmed inclusion of ETH in US Crypto Strategic Reserve.
 Ethereum Price Action (ETH)
Rather than pushing for more gains on Monday, the majority of short-term ETH traders opted to lock-in some profit early.
This led to a sharp 16% correction, as ETH stumbled towards the $2,100 mark.
The Ethereum price pull back on Monday mirrored all four other assets included in the crypto strategic reserve scoring considerable losses on Monday.
This signals that the retracement was only a sell-the-news action, a scenario where traders capitalize on euphoria from a positive news event to sell some of their holdings.
Typically if fundamentals remain positive, the bulls could push for a continuation of the rally.
Ethereum Foundation’s leadership shuffle could lift long-term sentiment
The global crypto market sentiment remains agog with media interest as Trump’s announcements are expected to enhance the global appeal of the global crypto markets, particularly likely to drive adoption of the ETH and the other four assets in the coming weeks.
However, another key factor that could enhance ETH’s long-term appeal is the recent leadership shuffle at the Ethereum Foundation.
According to an official announcement on February 28, the team of developers tasked with running the Ethereum network will now be headed by Hsiao-Wei Wang and Tomasz Stańczak as co-executive directors, replacing Aya Miyaguchi, who transitions to the role of Foundation President.
After recent network update flops, and increased market supply, many investors anticipate the leadership restructuring could set the Ethereum project back on track.
Bears capitalized on market dip to mount $1.8 billion resistance
While Ethereum foundation’s leadership shuffle could potentially align with Trump crypto strategic reserve announcement to form dual bullish catalysts in the near future, ETH price action could slow down significantly in the short-term.
Validating this stance, Coinglass’ liquidation map data tracks the compartes total leverage deployed on short contracts to long contracts, providing real-time insights in the dominant short-term market sentiment.
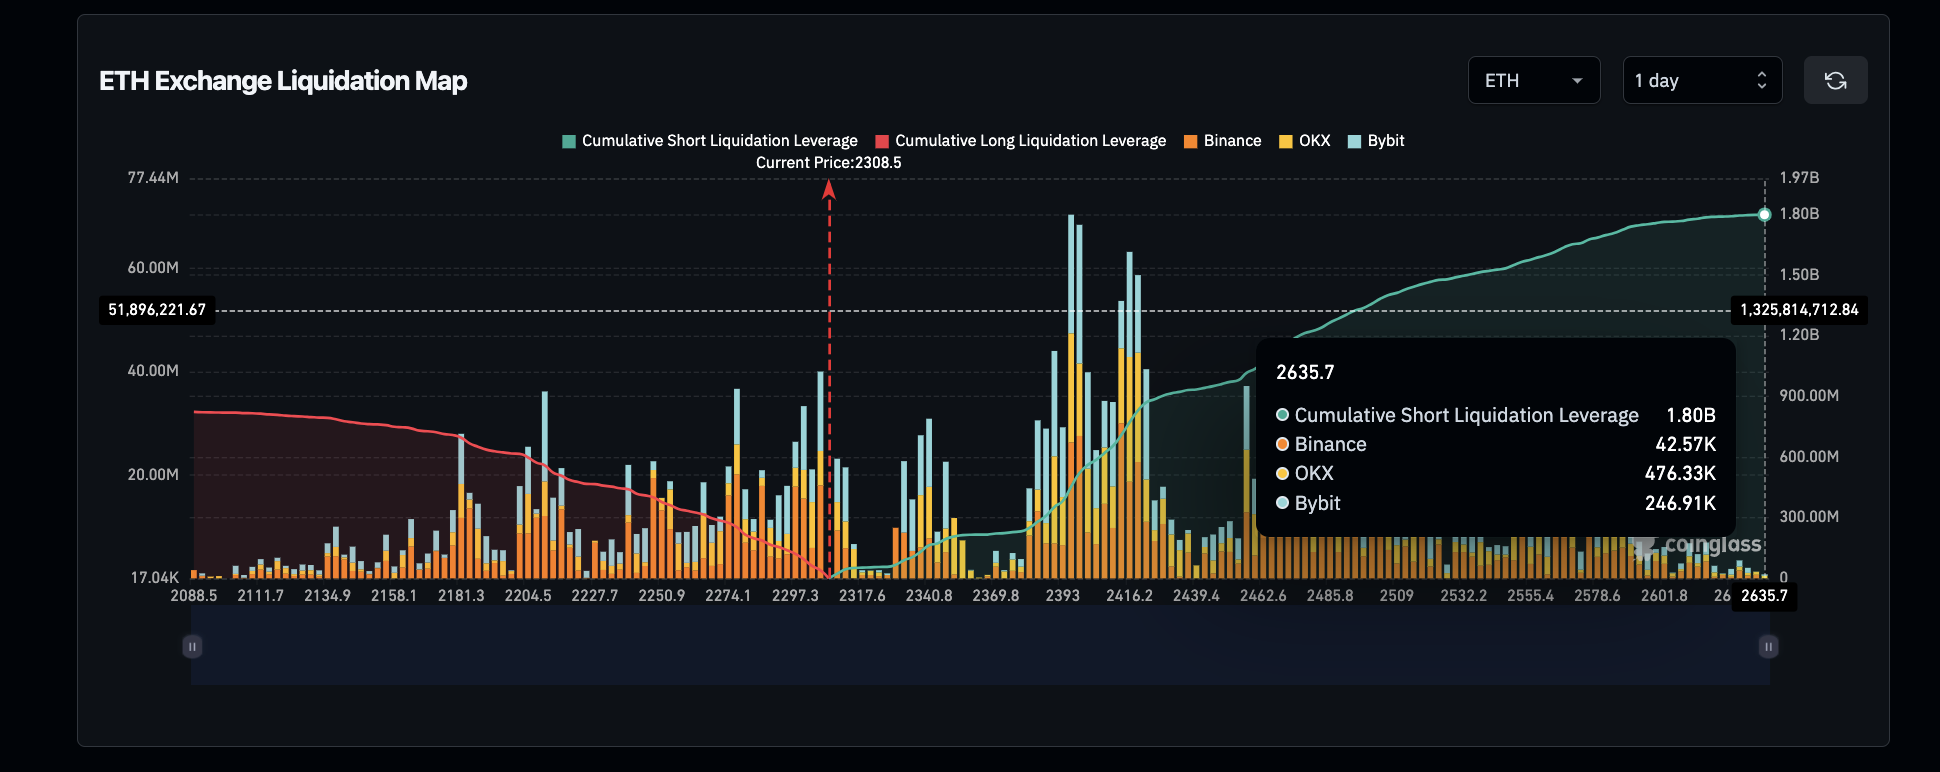
Ethereum (ETH) Liquidation Map | Source: Coinglass
As seen above, as traders began booking profits on monday, bears capitalized on a 16% price downswing to deploy $1.8 billion worth of short-leverage.
Comparing this to the $832 million worth of active long leverage, the bears have effectively established a 55% dominance on short-term capital outlay.
Looking closer, the majority of the SHORT contracts have been clustered around the $2,400 price level.
Traders holding these positions opt to deploy stop-loss orders to protect against potential price rebounds, automatically closing positions if ETH's price rises beyond a certain threshold.
These bearish maneuvers could intensify selling pressure, preventing ETH price from crossing the $2,400 mark in the coming trading sessions.
ETH Price Forecast: Bears setting up for prolonged consolidation below $2,400
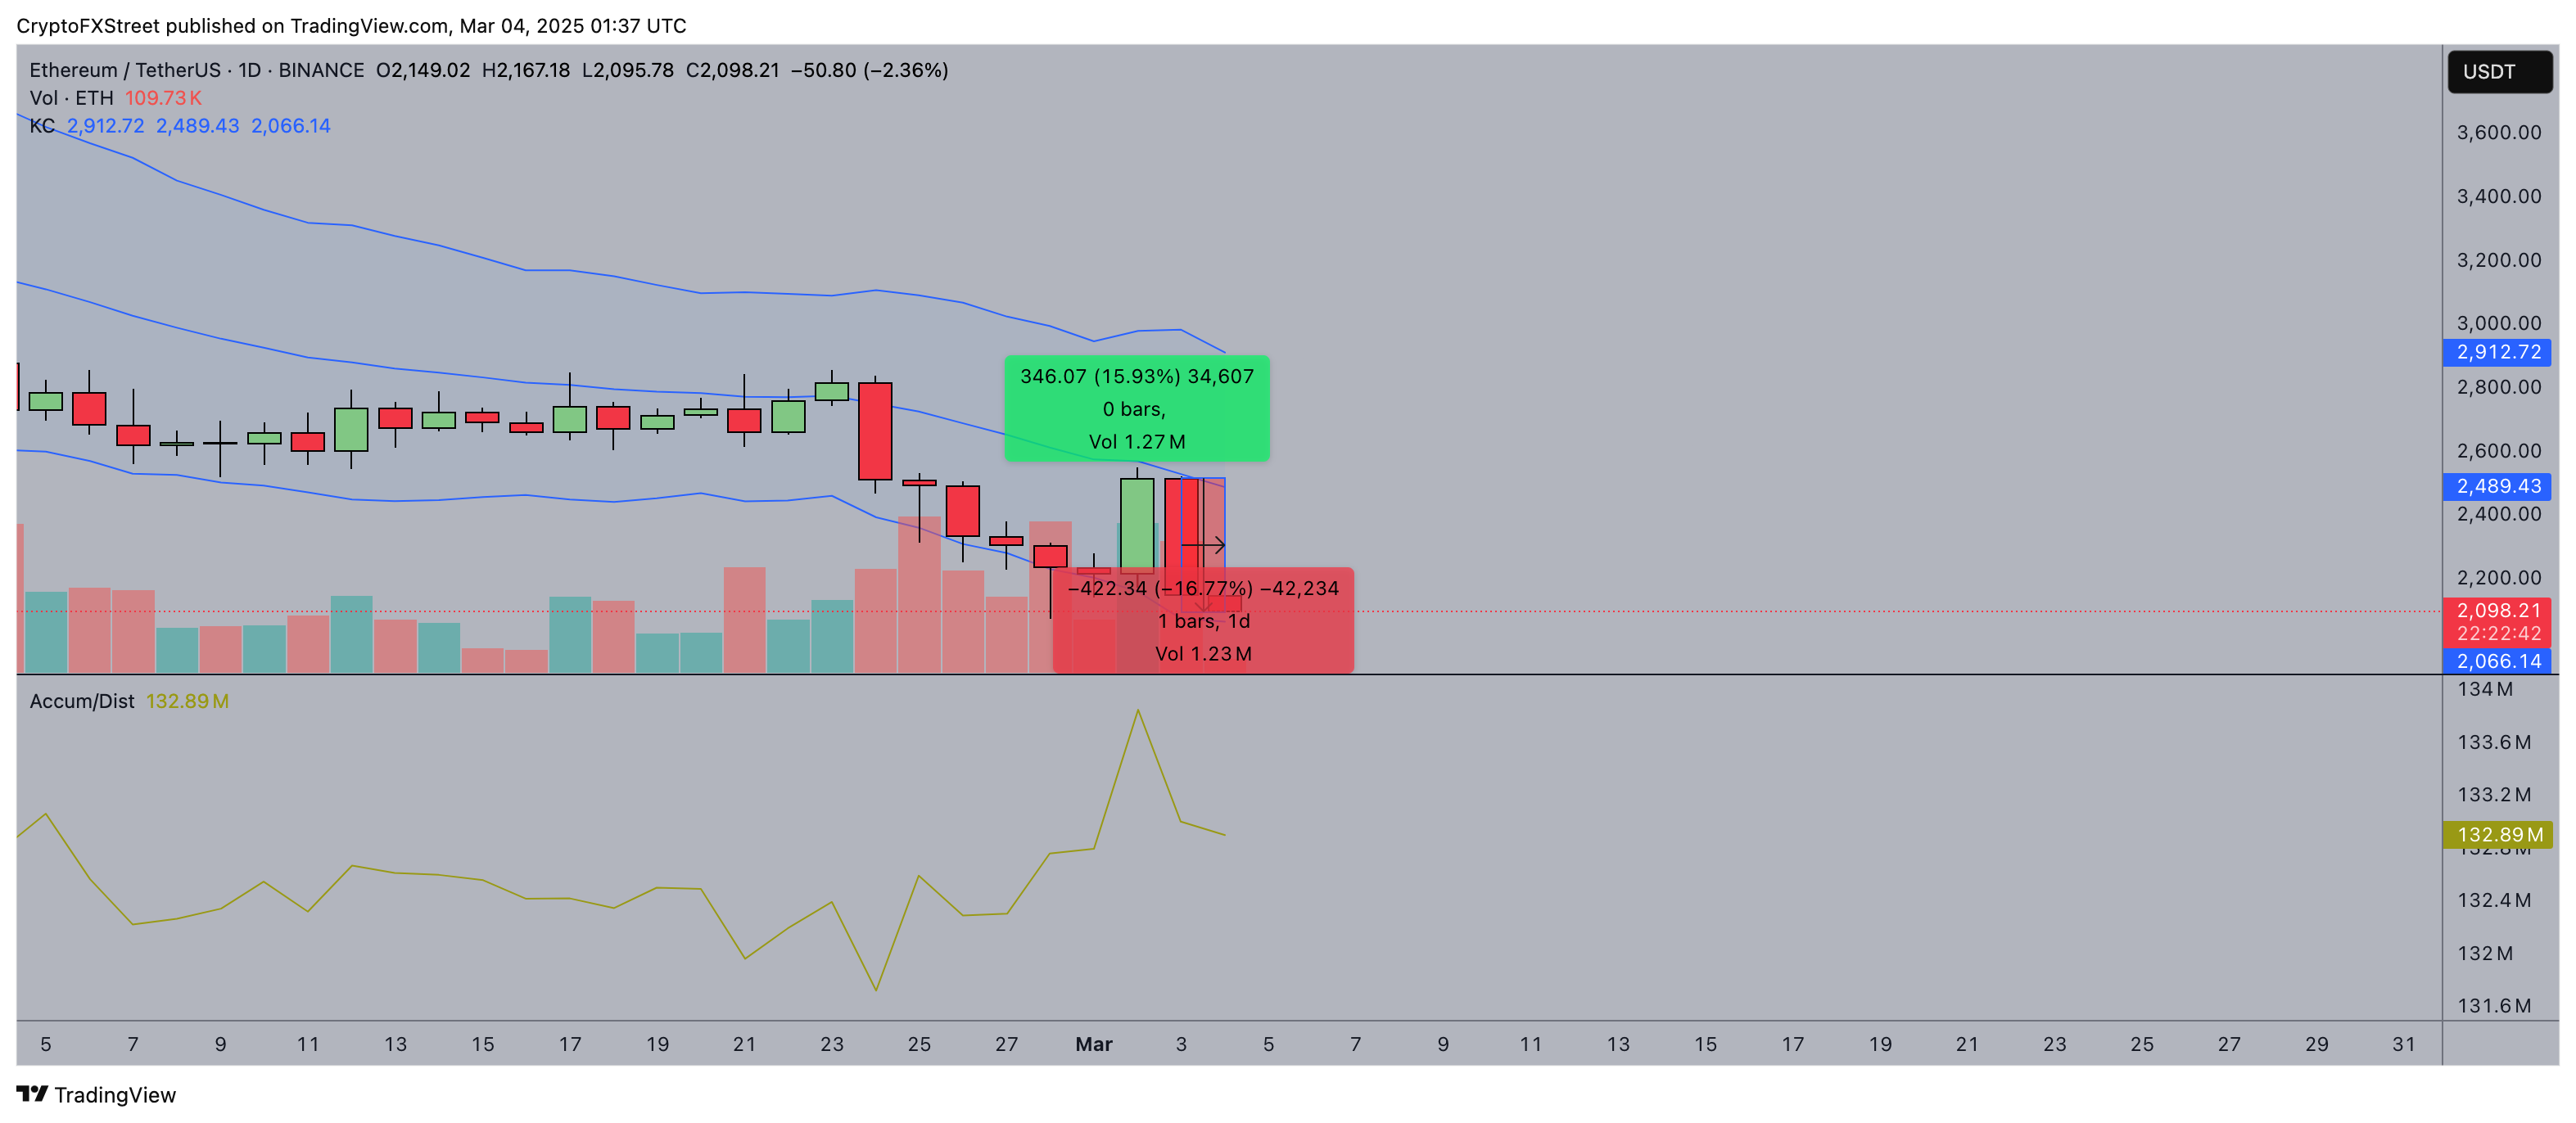
Ethereum price remains under bearish pressure, with the latest rejection from $2,489.43 suggesting sellers are setting up for prolonged consolidation below $2,400.
The daily chart shows Ethereum struggling beneath the midline of the Keltner Channel (KC) at $2,489, reinforcing the bearish grip on the market.
The lower bound at $2,066 now emerges as the next potential support if downward momentum intensifies.
 ETH Price Forecast
The Accumulation/Distribution (A/D) indicator, currently at 132.89 million, reflects waning buying interest, with the latest downtrend in the metric suggesting capital outflows.
This aligns with the sharp 16.77% daily drop observed in the red bearish candle, confirming aggressive selling pressure.
The recent failed bullish attempt, marked by the 15.93% recovery candle, suggests that upside liquidity around $2,400 is being absorbed, setting the stage for a potential breakdown.
However, a resurgence above the midline at $2,489 could shift sentiment, invalidating the bearish outlook and opening the door for a rebound toward $2,912.
Until then, Ethereum remains vulnerable to further declines.
Artigos Recomendados


