
Bitcoin Price Forecast: BTC stalemate soon coming to an end
- Bitcoin price has been consolidating between $94,000 and $100,000 for almost two weeks.
- US Bitcoin spot ETF data recorded a total net outflow of $580.2 million last week.
- Despite BTC price consolidation, on-chain data shows signs of accumulation.
Bitcoin (BTC) price has been consolidating between $94,000 and $100,000 for almost two weeks. Amid this consolidation, investor sentiment remains indecisive, with US spot Exchange Traded Funds (ETFs) recording a $580.2 million net outflow last week, signaling institutional demand weakness. At the same time, CryptoQuant data suggests continued accumulation through the 30DMA exchange inflow/outflow ratio.
Bitcoin price consolidates while institutional demand weakens
The Glassnode report last week states, “Bitcoin price has been wildly volatile and ultimately flat over the last few weeks. It has traded up to a high of $105,000, down to a low of $93,000, and ended the week where it started.”
The report further explains that this unstable price action resulted in a substantial loss of $520 million (the largest local capitulation event) when priced in USD. However, when assessing the severity of the drawdown through a normalized measure, the sell-off remains broadly in line with other local corrections.
Looking down on the average Short-Term Holder cost basis chart below, the report highlights that it has historically acted as a strong support level during a bull market uptrend. This pricing model currently trades at around $92,200 and is a key region to hold for the market to avoid further downside.
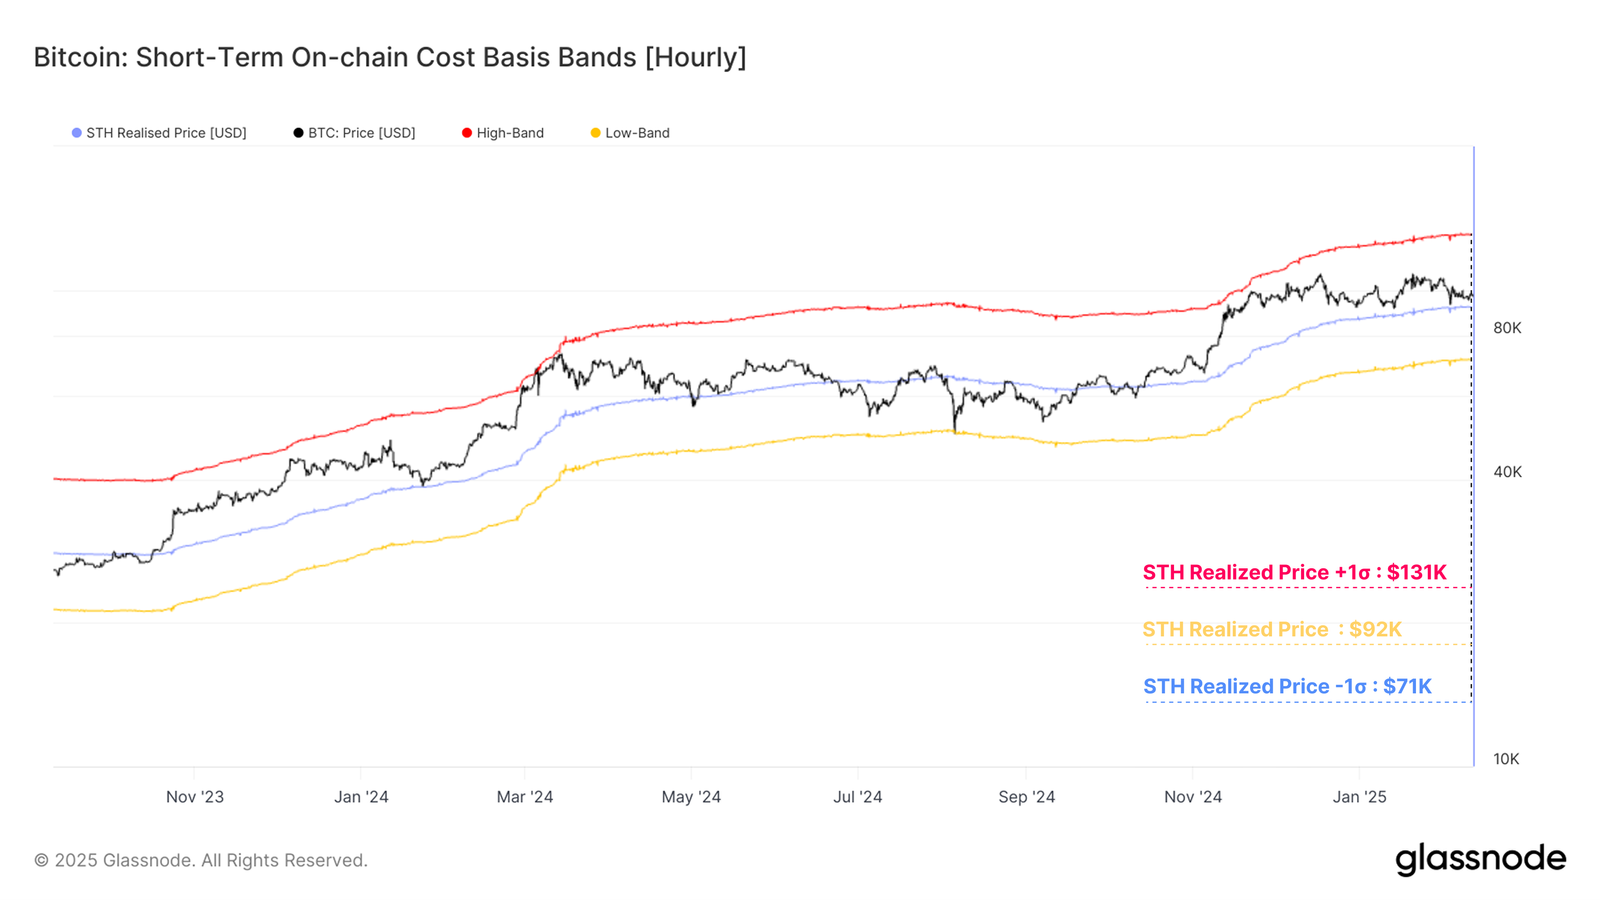
Bitcoin: Short-term on-chain cost basis bands (Hourly) chart. Source: Glassnode
In an exclusive interview with Hyblock, analysts told FXStreet, "Bitcoin remains in a consolidation phase, with two key trading zones to watch: $99,600 - $99,900 (upside) and $95,600 - $95,900 (downside). A move toward $94,00 could create a strong buy opportunity if confluence signals align, while resistance remains at $108,000."
Diving down into Bitcoin’s institutional demand, it shows signs of weakness. According to Coinglass, Bitcoin spot ETF data recorded net outflows of $580.2 million last week compared to $203.8 million inflows in the previous one. If the magnitude of the outflow continues and intensifies, the Bitcoin price could see further corrections.
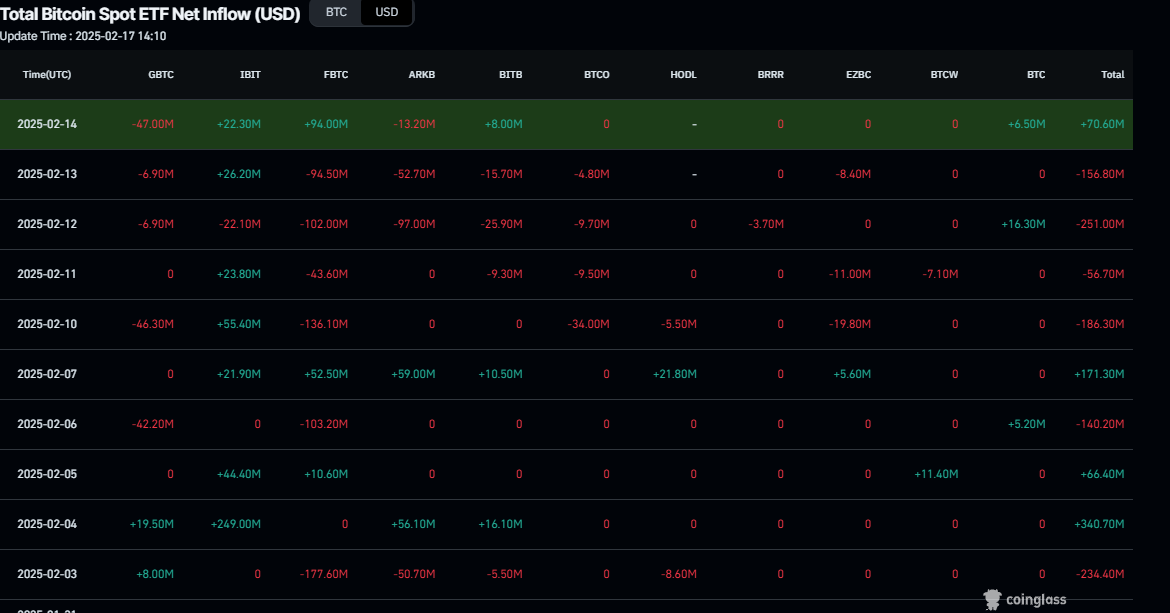
Total Bitcoin spot ETF net inflow chart. Source: Coinglass
Some optimistic signs for Bitcoin
CryptoQuant data shows that despite Bitcoin trading within a broad range between $90,000 and $105,000, there is clear evidence of continued accumulation, as indicated by the 30DMA exchange inflow/outflow ratio.
The chart below shows that the ratio currently reads 0.98, dropping below 1. It suggests that outflows dominate inflows, which many professional investors view as bullish. Generally, the lower the ratio, the stronger the underlying demand appears.
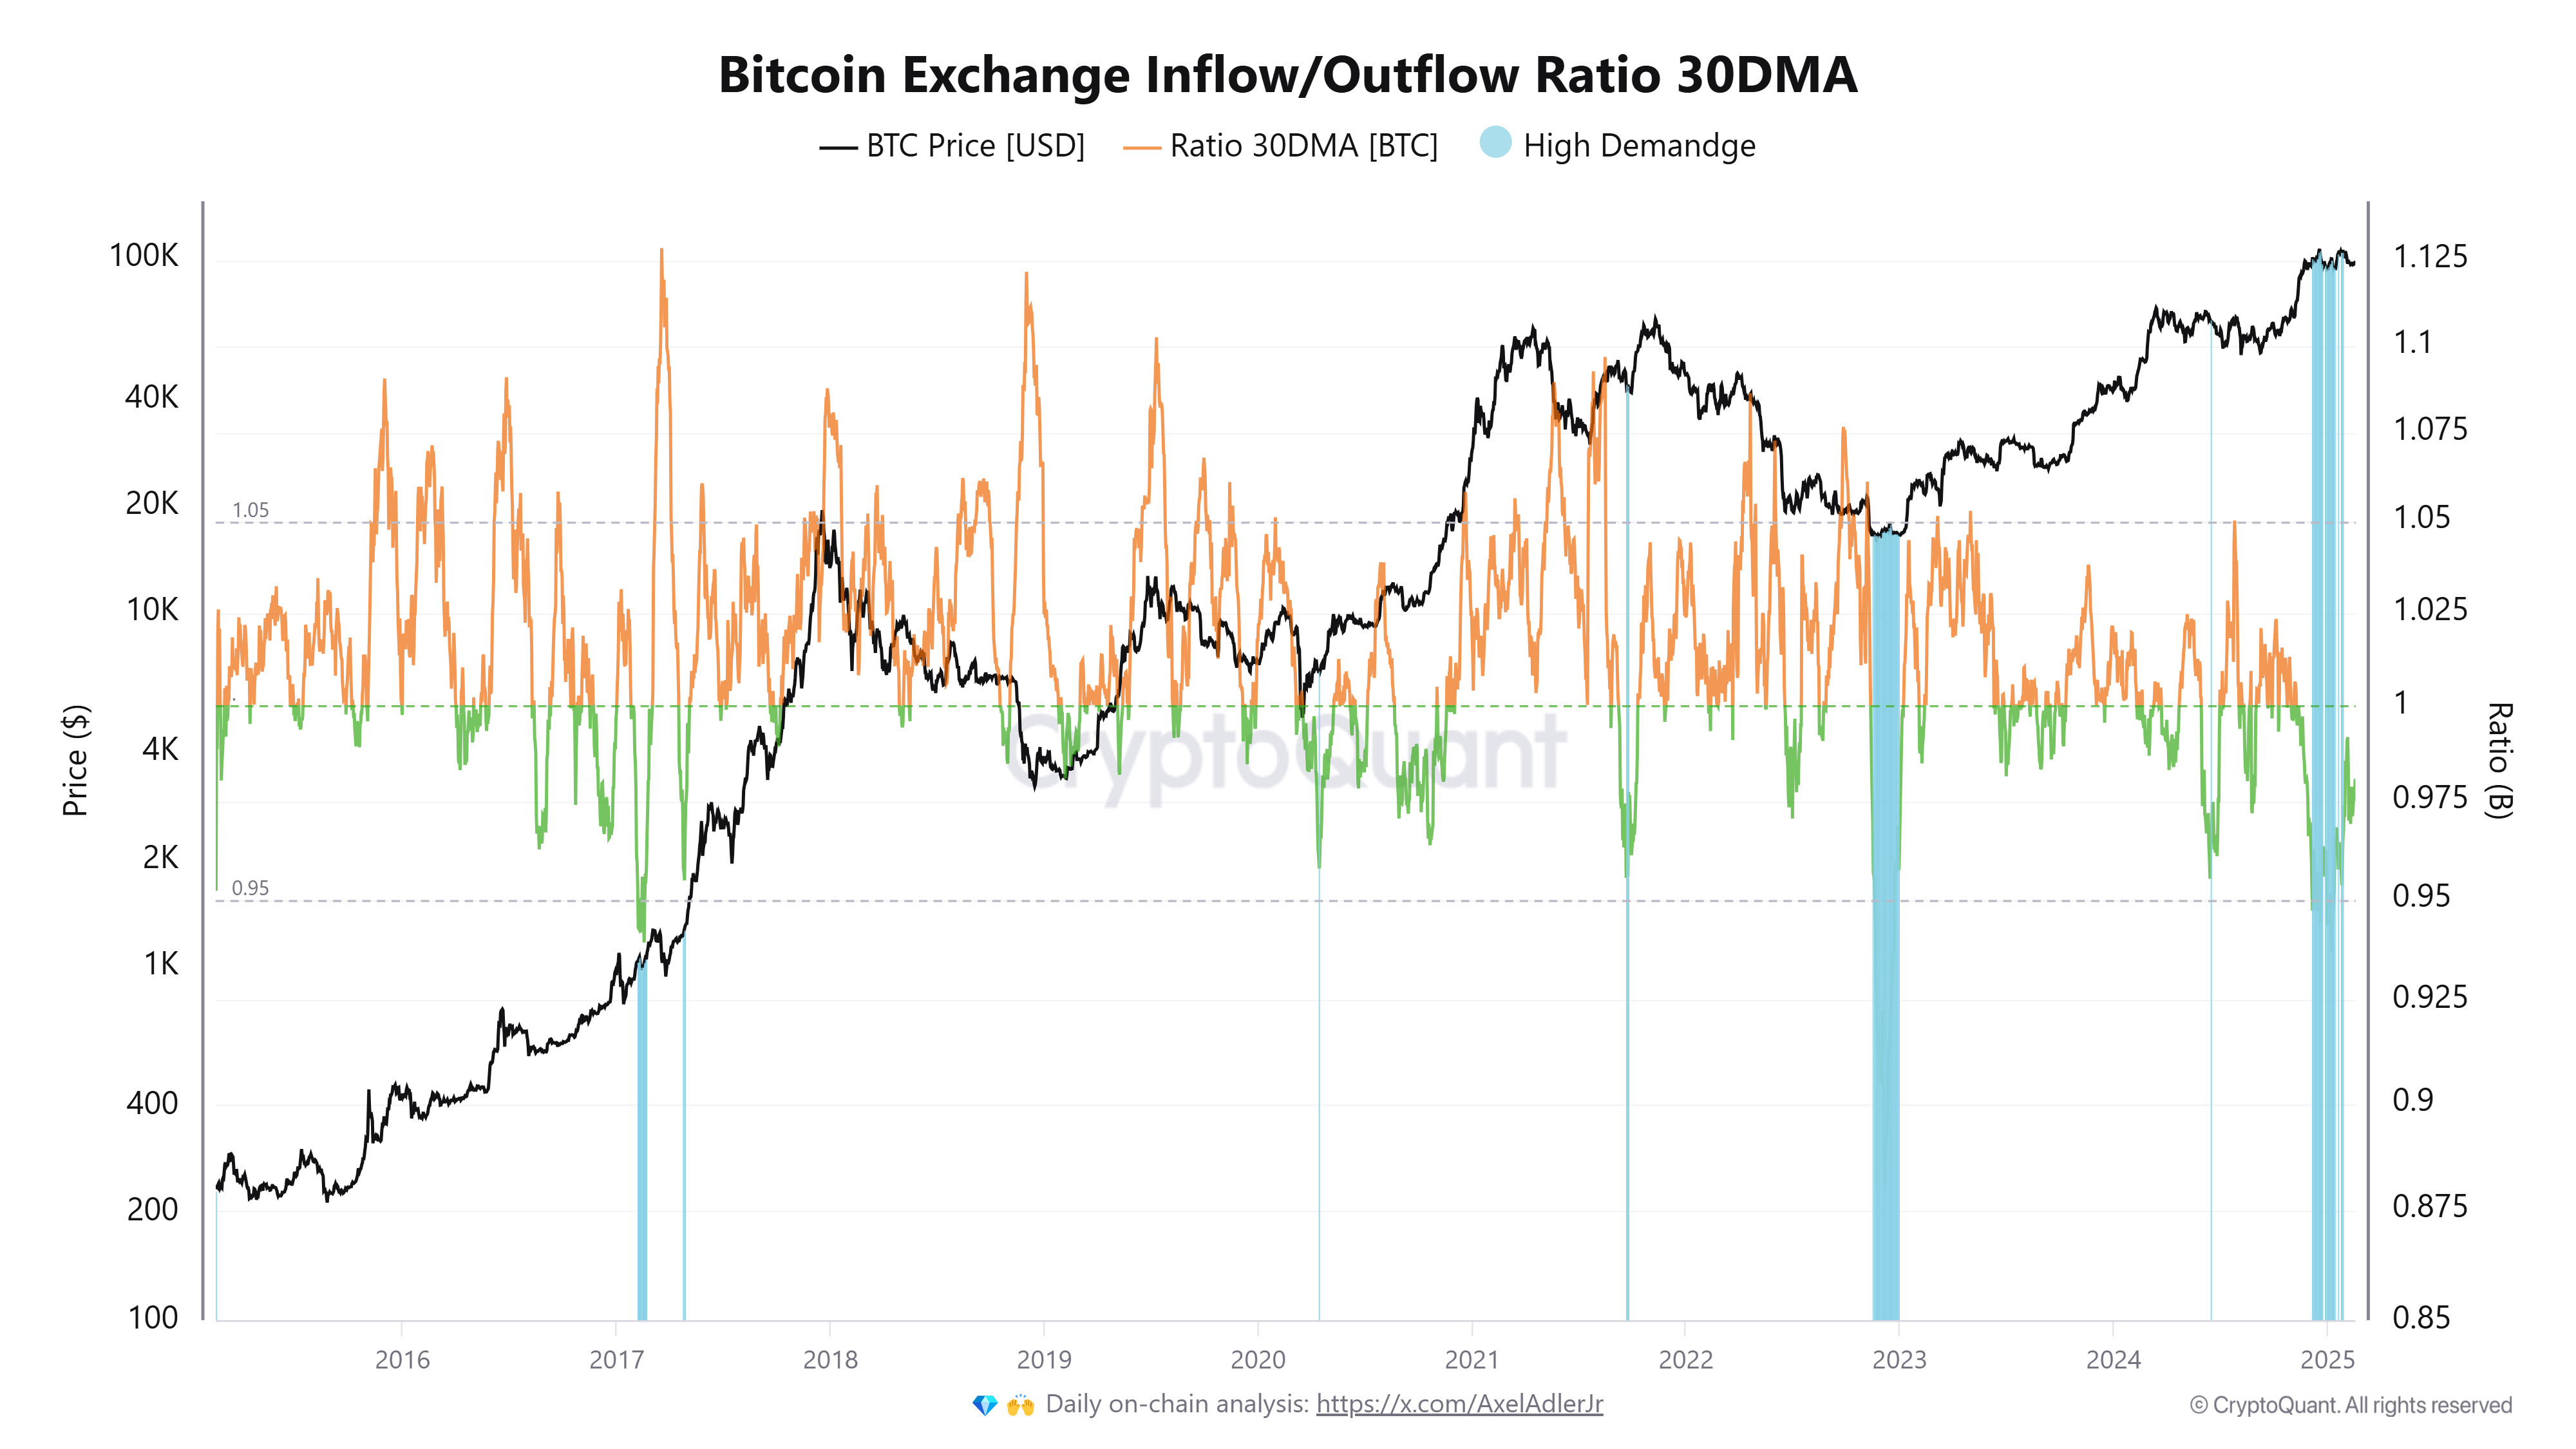
Bitcoin Exchange Inflow/Outflow ratio 30DMA chart. Source: CryptoQuant
Other optimistic signs for Bitcoin include US President Trump's nomination of Brian Quintenz last week to be the next Chairman of the Commodity Futures Trading Commission (CFTC). Quintenz expressed his gratitude for the nomination on X. Known for his pro-crypto stance, he added that “…the agency is also well poised to ensure the USA leads the world in blockchain technology and innovation.”
It is my great honor to be nominated by President @realDonaldTrump as the next Chairman of the Commodity Futures Trading Commission, where I had served as a Commissioner in his last administration. The @CFTC plays a critical role in maintaining robust hedging and price discovery…
— Brian Quintenz (@BrianQuintenz) February 12, 2025
Moreover, the K33 report last week explains that this latest appointment shows that President Trump’s pro-crypto agenda is set to continue while potentially positioning the CFTC to play a larger role in regulating the industry. In a related move, Trump selected Jonathan Gould, a former executive at crypto firm Bitfury, to head the Office of the Comptroller of the Currency, further solidifying a crypto-friendly regulatory shift.
Bitcoin Price Forecast: Two weeks of price consolidation
Bitcoin price broke below the $100,000 support level on February 4 and has been consolidating between $94,000 and $100,000 since then. At the time of writing on Monday, BTC hovers around $96,100.
If BTC breaks and closes below the lower boundary of the consolidating range of $94,000, it could extend the decline to test its psychologically important level of $90,000.
The Relative Strength Index (RSI) on the daily chart reads 43, consolidating after being rejected at its neutral level of 50 last week and indicating slightly bearish momentum. Moreover, the Moving Average Convergence Divergence (MACD) showed a bearish crossover and red histogram bars, hinting at further correction.
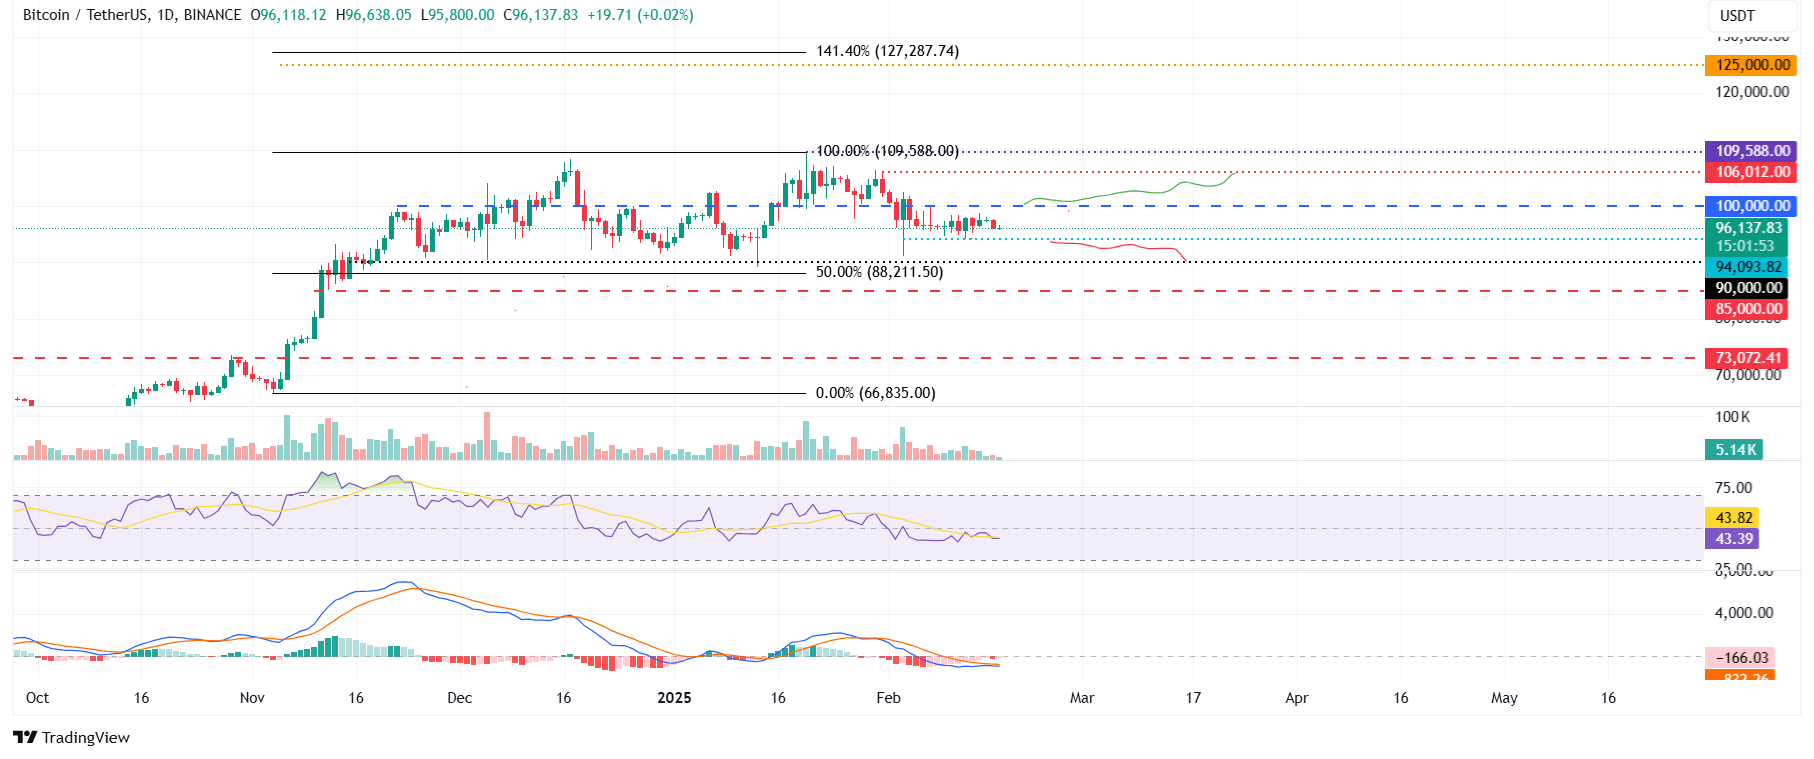
BTC/USDT daily chart
However, if BTC recovers and breaks above the upper boundary of the consolidating range of $100,000, it would extend the recovery to retest its January 31 high of $106,012.
Bitcoin, altcoins, stablecoins FAQs
Bitcoin is the largest cryptocurrency by market capitalization, a virtual currency designed to serve as money. This form of payment cannot be controlled by any one person, group, or entity, which eliminates the need for third-party participation during financial transactions.
Altcoins are any cryptocurrency apart from Bitcoin, but some also regard Ethereum as a non-altcoin because it is from these two cryptocurrencies that forking happens. If this is true, then Litecoin is the first altcoin, forked from the Bitcoin protocol and, therefore, an “improved” version of it.
Stablecoins are cryptocurrencies designed to have a stable price, with their value backed by a reserve of the asset it represents. To achieve this, the value of any one stablecoin is pegged to a commodity or financial instrument, such as the US Dollar (USD), with its supply regulated by an algorithm or demand. The main goal of stablecoins is to provide an on/off-ramp for investors willing to trade and invest in cryptocurrencies. Stablecoins also allow investors to store value since cryptocurrencies, in general, are subject to volatility.
Bitcoin dominance is the ratio of Bitcoin's market capitalization to the total market capitalization of all cryptocurrencies combined. It provides a clear picture of Bitcoin’s interest among investors. A high BTC dominance typically happens before and during a bull run, in which investors resort to investing in relatively stable and high market capitalization cryptocurrency like Bitcoin. A drop in BTC dominance usually means that investors are moving their capital and/or profits to altcoins in a quest for higher returns, which usually triggers an explosion of altcoin rallies.
Artigos Recomendados


