
Litecoin Price Forecast: LTC bulls aim for higher highs
- Litecoin price trades higher on Monday after retesting its key support level the previous week.
- The technical outlook and LTC’s long-to-short ratio suggest a rally ahead.
- Traders should remain cautious as LTC’s NPL metric indicates holders are taking some profit.
Litecoin (LTC) price pops higher by over 8% and trades around $116.00 at the time of writing on Monday after retesting its key support level the previous week. The technical outlook and LTC’s long-to-short ratio suggest a rally ahead. However, traders should remain cautious as LTC’s Network Realized Profit/Loss (NPL) metric spiked, indicating holders are taking some profit, which could increase the selling pressure.
Litecoin price poised for a rally as it retested key support level
Litecoin price declined and retested its 200-week Exponential Moving Average (EMA) at $86.22 during the first half of last week and bounced, closing above its weekly support level at $96.30 in the second half. Moreover, it retested and bounced from the descending trendline drawn by connecting weekly highs since the end of March 2022. At the time of writing on Monday, it continues to trade higher around $116.63.
If LTC continues its recovery, it could extend its rally to retest its December 5 high of $147.06.
The Relative Strength Index (RSI) on the weekly chart reads 57, above its neutral level of 50, indicating a rise in bullish momentum.
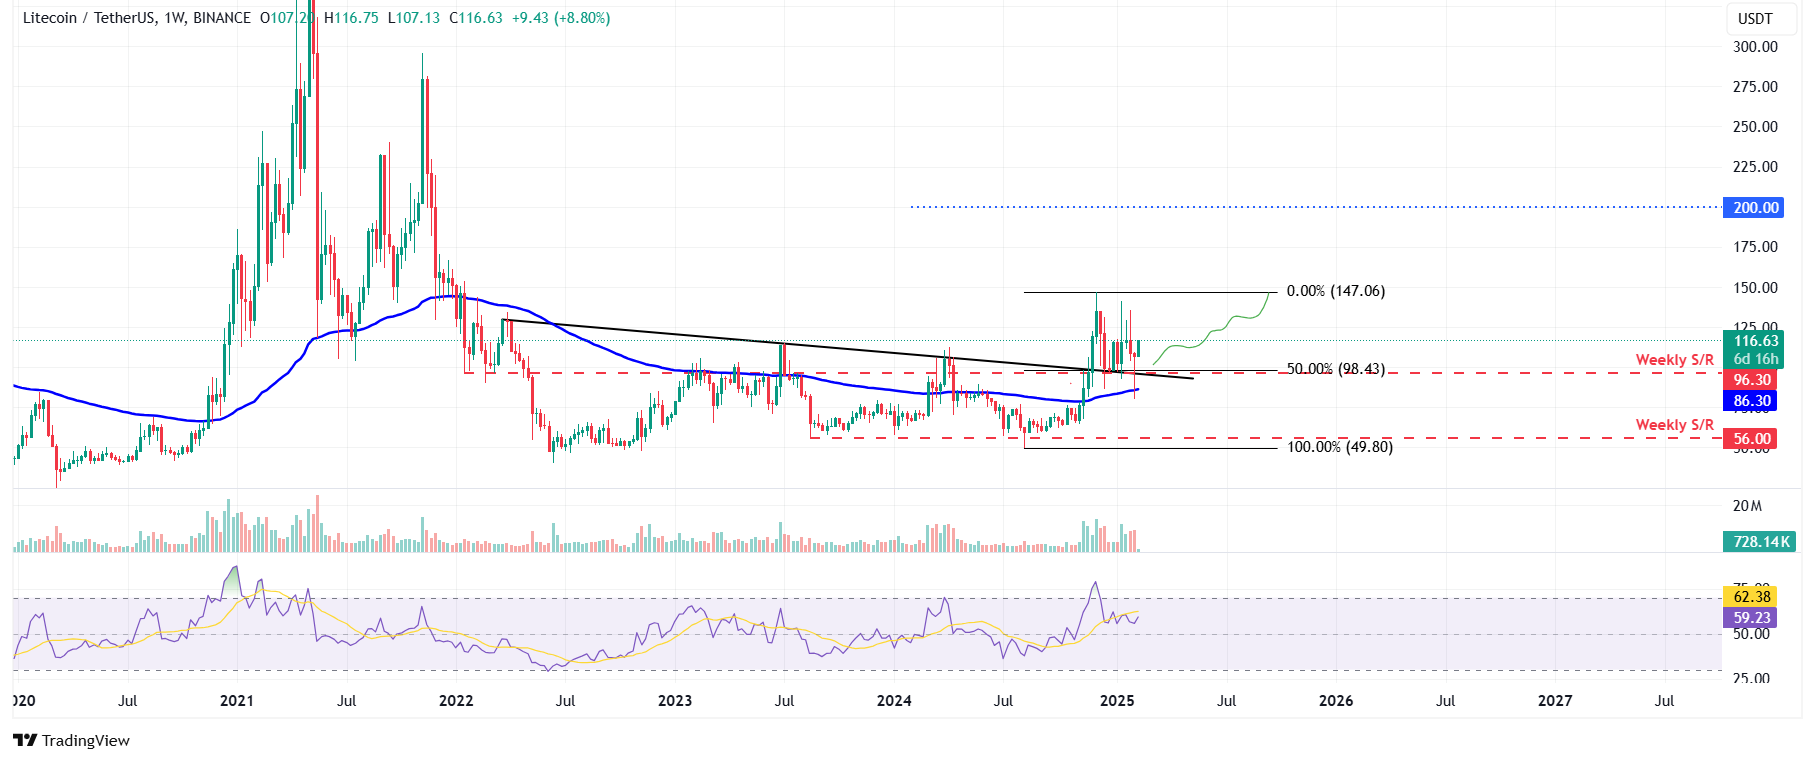
LTC/USDT weekly chart
Another bullish sign is Coinglass’s LTC long-to-short ratio, which reads 1.07 and has continued increasing since early February. This ratio above one reflects bullish sentiment in the markets as more traders are betting for the asset price to rise.
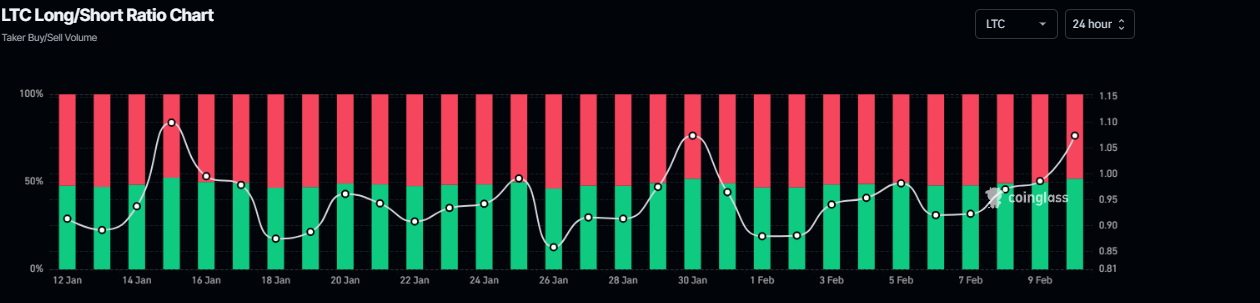
LTC long-to-short ratio chart. Source: Coinglass
However, traders should be cautious as on-chain data provider Santiment’s Network Realized Profit/Loss (NPL) indicator for LTC shows strong spikes. Strong spikes in a coin’s NPL indicate that its holders are, on average, selling their bags at a significant profit, which could increase the selling pressure.
In LTC’s case, the NPL indicator spiked from 1.39 million to 51.59 million from Thursday to Friday.
 [11.42.08, 10 Feb, 2025]-638747770102758532.png)
LTC Network Realized Profit/Loss chart. Source: Santiment
Artigos Recomendados


