

Top 3 Price Prediction Bitcoin, Ethereum, Ripple: BTC & ETH rebound, XRP rallies ahead of CPI data
- Bitcoin price rebounds after retesting its key psychological level at $90,000.
- Ethereum price finds support around its 200-day EMA at $3,114, eyeing a recovery ahead.
- Ripple price found support around its upper symmetrical triangle throwback, suggesting a rally ahead.
Bitcoin (BTC) and Ethereum (ETH) prices continue to recover on Wednesday after finding support around their key levels this week. On the other hand, Ripple (XRP) remains strong and found support around its upper symmetrical triangle boundary, suggesting a rally continuation.
Bitcoin rebounds after retesting its $90,000 support level
Bitcoin price dipped, reaching a low of $89,256, but recovered quickly and closed above $94,500 on Monday. On Tuesday, it rebounded by 2.14% and closed above $96,500. At the time of writing on Wednesday, it continues its recovery, trading around $97,400.
If BTC continues its recovery and closes above the $100,000 level, it could extend the rally to retest the December 17, 2024, all-time high of $108,353.
The Relative Strength Index on the daily chart reads 53, above its neutral level of 50 and points upwards, indicating a rise in bullish momentum. Additionally, the Moving Average Convergence Divergence (MACD) indicator is about to flip a bullish crossover. If the MACD line closes above the signal line, it would give a buy signal and suggest an uptrend.
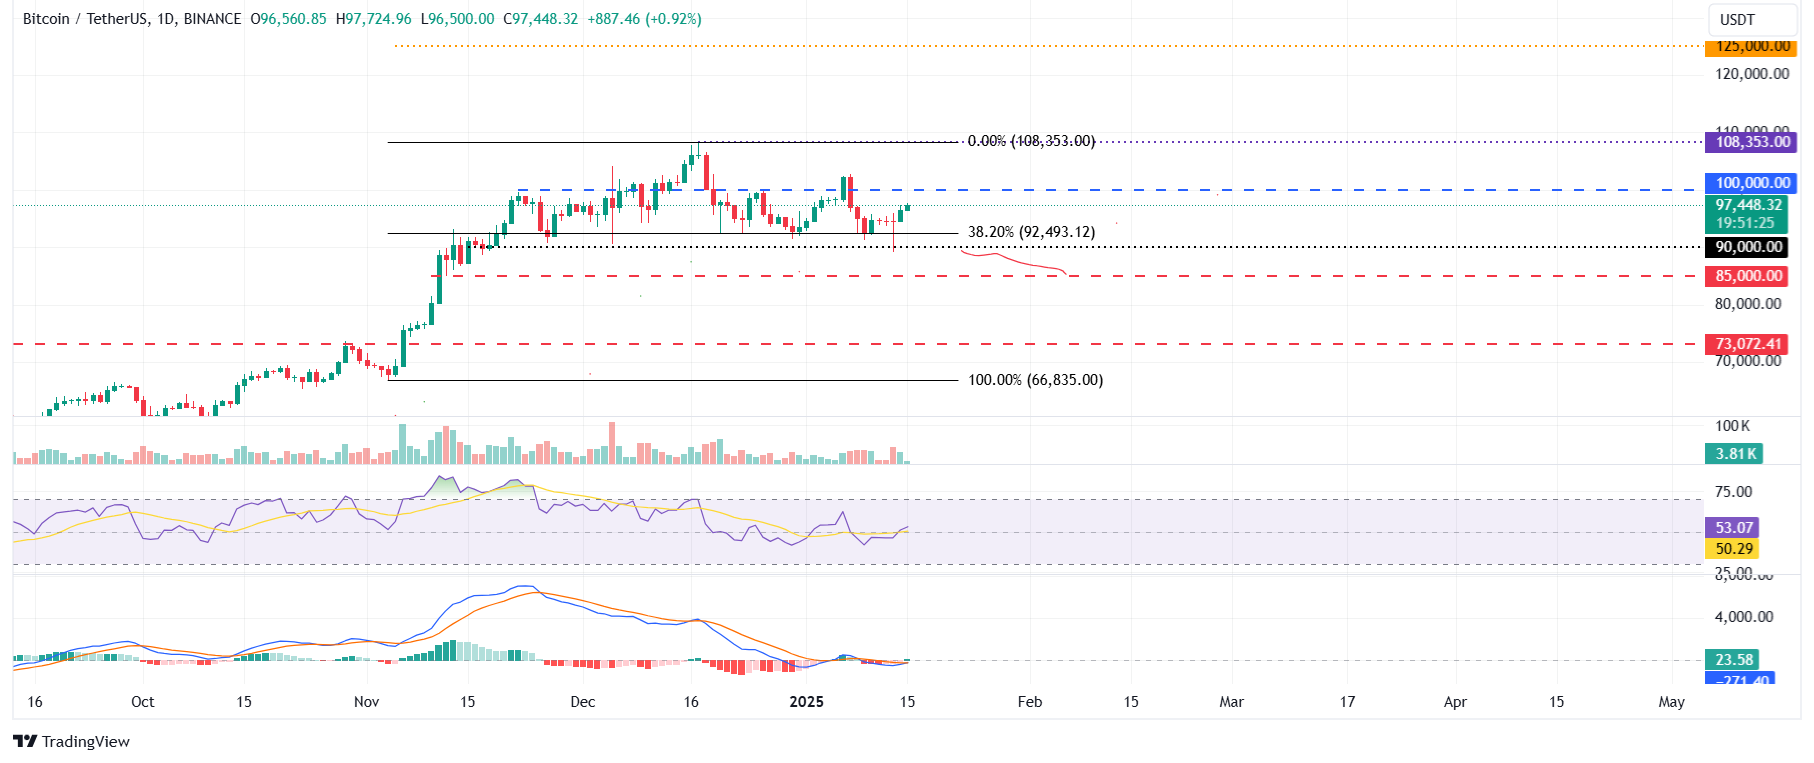
BTC/USDT daily chart
However, if BTC continues its correction and closes below $90,000, it will extend an additional decline to retest its next support level at $85,000.
Ethereum price rebound slightly after retesting its 200-day EMA
Ethereum price faced rejection around the daily resistance level of $3,730 on January 6 and declined 15.47% until Monday, reaching a low of $2,920. However, it rebounded and closed above its 200-day Exponential Moving Average (EMA) at $3,114 and recovered 2.81% the next day. At the time of writing on Wednesday, it hovers around $3,223.
If ETH continues its rebound and closes above $3,235, it could extend the recovery to test its daily resistance level at $3,730.
However, the RSI indicator on the daily chart reads 41, below its neutral level of 50, indicating bearish momentum. The MACD indicator also shows a bearish crossover, suggesting a sell signal and a downtrend.
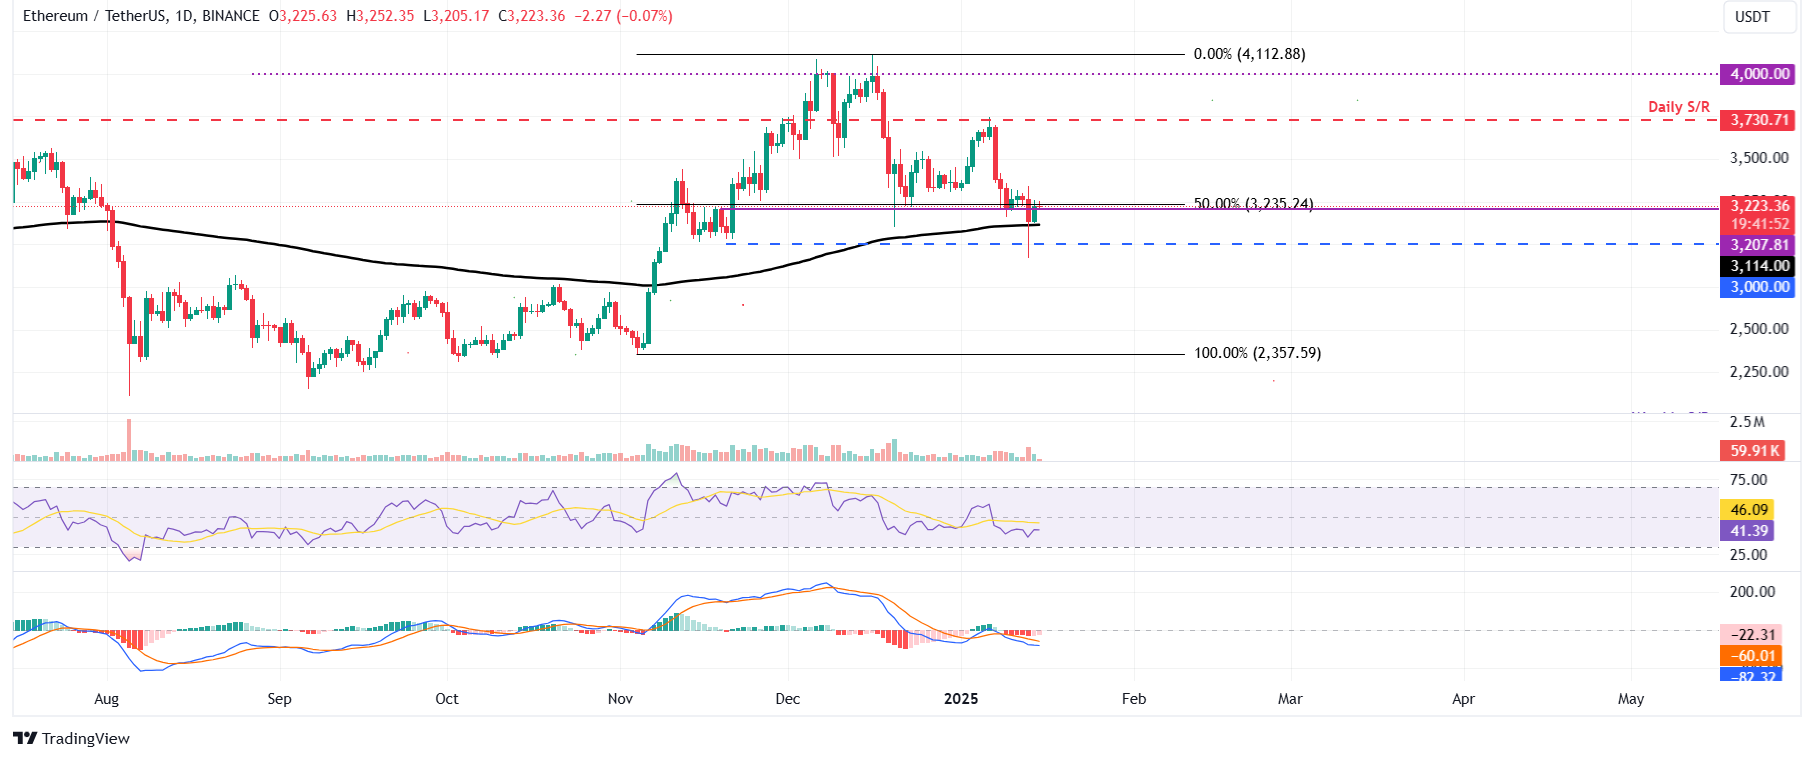
ETH/USDT daily chart
On the other hand, If ETH closes below the $3,114 support level, it could extend the decline to test its psychological importance level of $3,000.
Ripple bulls eye the $3 mark
Ripple price retested its upper symmetrical triangle boundary of the symmetrical triangle pattern on Tuesday and rallied 5.17% the next day. This technical pattern was formed by connecting multiple highs and lows with two converging trendlines (from early December to early January). This technical pattern has a bullish bias, and the target is generally obtained by measuring the distance between the first swing high and the first swing low to the breakout point. At the time of writing on Wednesday, it continues to trade higher around $2.80.
If XRP continues its upward momentum, it could extend the rally to test its technical target obtained by this pattern, which would be $3.63. Investors should be cautious of this theoretical move as it could face a slowdown after testing its psychological importance level of $3.00 as traders could opt to book profits.
The RSI indicator reads 67, above its neutral value of 50, indicating bullish momentum. Additionally, the MACD shows a bullish crossover, suggesting a continuation of an upward trend.
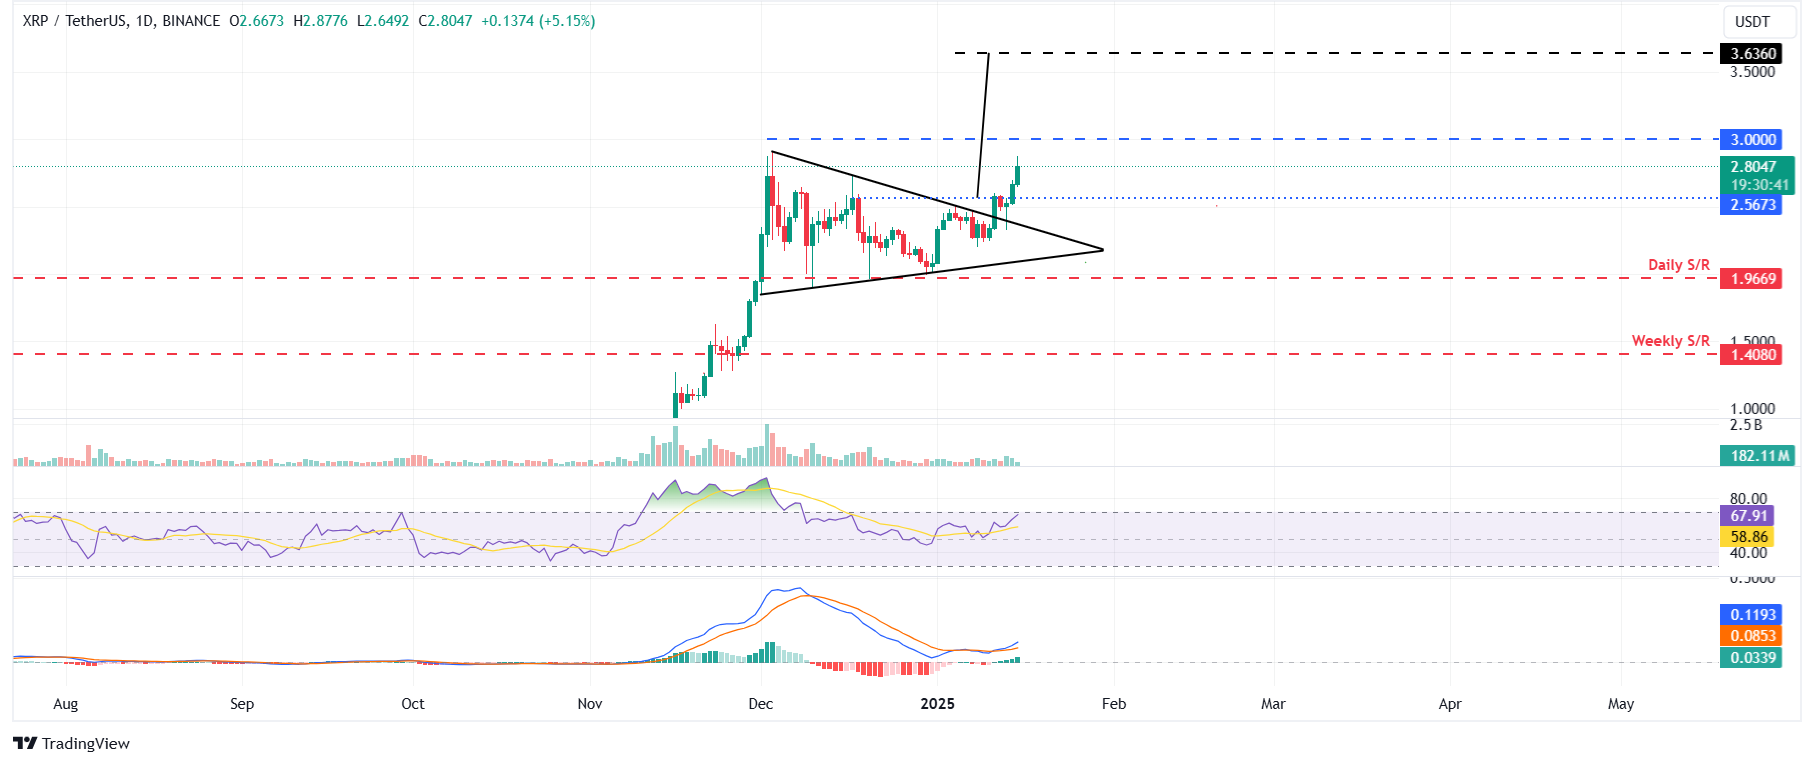
XRP/USDT daily chart
However, if XRP closes below the $1.96 daily support level, it would extend the decline to retest its next support level at $1.40.
Bitcoin, altcoins, stablecoins FAQs
Bitcoin is the largest cryptocurrency by market capitalization, a virtual currency designed to serve as money. This form of payment cannot be controlled by any one person, group, or entity, which eliminates the need for third-party participation during financial transactions.
Altcoins are any cryptocurrency apart from Bitcoin, but some also regard Ethereum as a non-altcoin because it is from these two cryptocurrencies that forking happens. If this is true, then Litecoin is the first altcoin, forked from the Bitcoin protocol and, therefore, an “improved” version of it.
Stablecoins are cryptocurrencies designed to have a stable price, with their value backed by a reserve of the asset it represents. To achieve this, the value of any one stablecoin is pegged to a commodity or financial instrument, such as the US Dollar (USD), with its supply regulated by an algorithm or demand. The main goal of stablecoins is to provide an on/off-ramp for investors willing to trade and invest in cryptocurrencies. Stablecoins also allow investors to store value since cryptocurrencies, in general, are subject to volatility.
Bitcoin dominance is the ratio of Bitcoin's market capitalization to the total market capitalization of all cryptocurrencies combined. It provides a clear picture of Bitcoin’s interest among investors. A high BTC dominance typically happens before and during a bull run, in which investors resort to investing in relatively stable and high market capitalization cryptocurrency like Bitcoin. A drop in BTC dominance usually means that investors are moving their capital and/or profits to altcoins in a quest for higher returns, which usually triggers an explosion of altcoin rallies.
Artigos Recomendados


